Yoo, Ro, Ko, Lee, Han, Kim, Shin, Kim, and Chang: Epidemiologic trends of patients who visited nationwide emergency departments: a report from the National Emergency Department Information System (NEDIS) of Korea, 2018–2022
Epidemiologic trends of patients who visited nationwide emergency departments: a report from the National Emergency Department Information System (NEDIS) of Korea, 2018–2022
1Department of Emergency Medicine, Samsung Medical Center, Sungkyunkwan University School of Medicine, Seoul, Korea
2National Emergency Medical Center, National Medical Center, Seoul, Korea
3Department of Emergency Medicine, Seoul National University College of Medicine, Seoul, Korea
4Department of Digital Health, Samsung Advanced Institute for Health Science & Technology (SAIHST), Sungkyunkwan University, Seoul, Korea
5Department of Emergency Medicine, Chosun University Hospital, Gwangju, Korea
Correspondence to: Hansol Chang Department of Emergency Medicine, Samsung Medical Center, Sungkyunkwan University School of Medicine, 81 Irwon-ro, Gangnam-gu, Seoul 06351, Korea Email: briquet90@naver.com
Co-correspondence to: Seongjung Kim Department of Emergency Medicine, Chosun University Hospital, 365 Pilmun-daero, Dong-gu, Gwangju 61453, Korea Email: ksj@nmc.or.kr
Received: September 26, 2023 Accepted: October 17, 2023
This study analyzed trends in emergency department (ED) visits in Korea using the National Emergency Department Information System (NEDIS) data from 2018 to 2022.
Methods
This was a retrospective observational study using data from the NEDIS database from 2018 to 2022. Age- and sex-standardized ED visits per 100,000 population, as well as age- and sex-standardized rates for mortality, admission, and transfer, were calculated.
Results
The standardized ED visits per 100,000 population was approximately 20,000 from 2018 to 2019 and decreased to about 18,000 in 2022. The standardized mortality rate ranged from 1.4% to 1.7%. The admission rate (18.4%–19.4%) and the transfer rates (1.6%–1.8%) were similar during the study period. Approximately 5.5% of patients were triaged as Korean Triage and Acuity Scale score 1 or 2. About 91% of patients visited the ED directly and 21.7% of patients visited the ED with an ambulance. The ED length of stay was less than 6 hours in 90.3% of patients and the ED mortality rate was 0.6%. Acute gastroenteritis was the most common diagnosis. Respiratory virus symptoms, such as fever and sore throat, were also common chief complaints.
Conclusion
ED visits decreased during the 5-year period, while admission, transfer, and death rates remained relatively stable.
The National Emergency Department Information System (NEDIS) is the basis of Korea’s medical infrastructure and collects data throughout the country.
What is new in the current study
This study reviews 5-year trends of emergency department visits in Korea with NEDIS, a national database. COVID-19 affected the 5-year trend of ED visits. Patients with severe illness diagnosis codes were separately investigated.
INTRODUCTION
The prompt and effective determination of patient management, especially in emergency medical care, holds importance in determining patient outcomes [1–3]. As the population numbers are increasing worldwide and with the emergence of new diseases, it is necessary to deal with problems that may arise [4–7], including in the emergency department (ED) [1,7].
The ED has important role in public health by establishing a social safety net. To develop evidence-based emergency care policy, it is important to evaluate and monitor epidemiological trend of demands and use of emergency medical services (EMS) [8,9]. To satisfy these demands, a data-based approach is needed, and the National Emergency Department Information System (NEDIS) in Korea was established [10,11]. This information is useful to examine the status of patients in emergency medical centers and evaluate and monitor emergency care quality [12–14].
The COVID-19 pandemic started at the end of 2019 and affected Korea from 2020 to 2022. During the COVID-19 pandemic, restrictions on gathering, increased isolation of patients, and increased medical resource demand affected the ED environment [3,15,16]. To address the COVID-19 pandemic, many policies and new medical methods and protocols were introduced, which changed the ED environment in several aspects. Therefore, ED visit trends from 2018 to 2022 were affected by COVID-19 pandemic.
This study aimed to evaluate the epidemiologic characteristics and trends of all patients who presented to a Korean ED between 2018 and 2022 using the national ED database. In addition, the study investigated the clinical outcomes of severely ill patients diagnosed with severe illness diagnosis code (SIDC), which includes 28 severe diseases that require urgent and proper treatment in an ED.
METHODS
Ethics statement
This study was approved by the Institutional Review Board of the National Medical Center, Korea (No. 2023-08-094). The need for informed consent was waived due to the retrospective, observational, and anonymous nature of the study. All methods were performed in accordance with the relevant guidelines and regulations. It was not appropriate or possible to involve patients or the public in the design, conduct, reporting, or dissemination plans of our research. The public was not involved in the design, conduct, reporting, or dissemination plans of this research.
Study design and population
This was a retrospective study using NEDIS database. Patients who visited the ED from 2018 to 2022 and whose information was collected in NEDIS database were included in this study.
Data source and collection
The NEDIS is the basis of Korea’s medical infrastructure and collects data throughout the country [7,11]. The NEDIS is an emergency patient information network that was established by the National Emergency Medical Center (Seoul, Korea) and the Ministry of Health and Welfare of Korea in 2003 [7,11,17]. Approximately 400 hospitals have been enrolled as emergency medical centers, and they transmit the information of patients who have visited emergency centers to the Central Emergency Medical Information Center [18–20]. The NEDIS collects data from patients who visit 151 EDs in Korea in real time.
The NEDIS database includes demographic information (age and sex), ED visit information (disease onset to ED visit time, reason for visiting ED, insurance, route of arrival, transport, chief complaint, initial and final Korean Triage Acuity Scale [KTAS] scores, visit date, and visit time), length of stay, final disposition at ED, and final disposition at hospital discharge of ED visit patient [12,18,21,22].
Public EMS is run by the 119 fire departments in Korea and managed by tax income [23]. Therefore, most EMS fees, such as ambulance fees, are free for patients, and therefore patient easily accessibility for public EMS. There are three levels of emergency centers according to their role in each region and local area and these are selected by certain criteria mentioned in the Emergency Medical Service Act. Information on the level of centers was also collected. Data on results after ED management (length of stay, disposition after ED discharge, final diagnosis, result at hospital discharge, and whether diagnosis code is included in critical diagnosis code) were collected. ED visit trends from 2018 to 2022 were affected by the COVID-19 pandemic [3,15,24,25].
Statistical analysis and measurement
Age- and sex-standardized ED visits per 100,000 population visits were calculated using the direct standardization method and the 2020 Korean population data obtained from Statistics Korea [26].
In-hospital mortality, age- and sex-standardized mortality, admission, and transfer rates were calculated. The crude and age- and sex- standardized death rates were calculated as a weighted average of the age/sex-specific death rates of a given population; the weights are the age and sex distribution of that population.
Descriptive statistics are provided for the demographic features and characteristics of ED. Variables with a normal distribution are expressed as the mean and standard deviation. Variables with a non-normal distribution are expressed as the median and interquartile range. Categorical variables are expressed as counts and percentages of the total data available within the database.
Five-year changes in the number of ED visits, admissions, transfers, and deaths were measured. The total number of visits, patient demographics, ED visit information, and outcome were measured by KTAS. The common chief complaint and frequent final diagnosis were measured.
In Korea, 28 critical diagnoses that need intensive and fast management are separately managed as SIDC because of their urgency. Among patients with critical diagnosis codes, the result after ED management and the final KTAS scores were additionally analyzed.
RESULTS
Annual change in ED visit and ED results
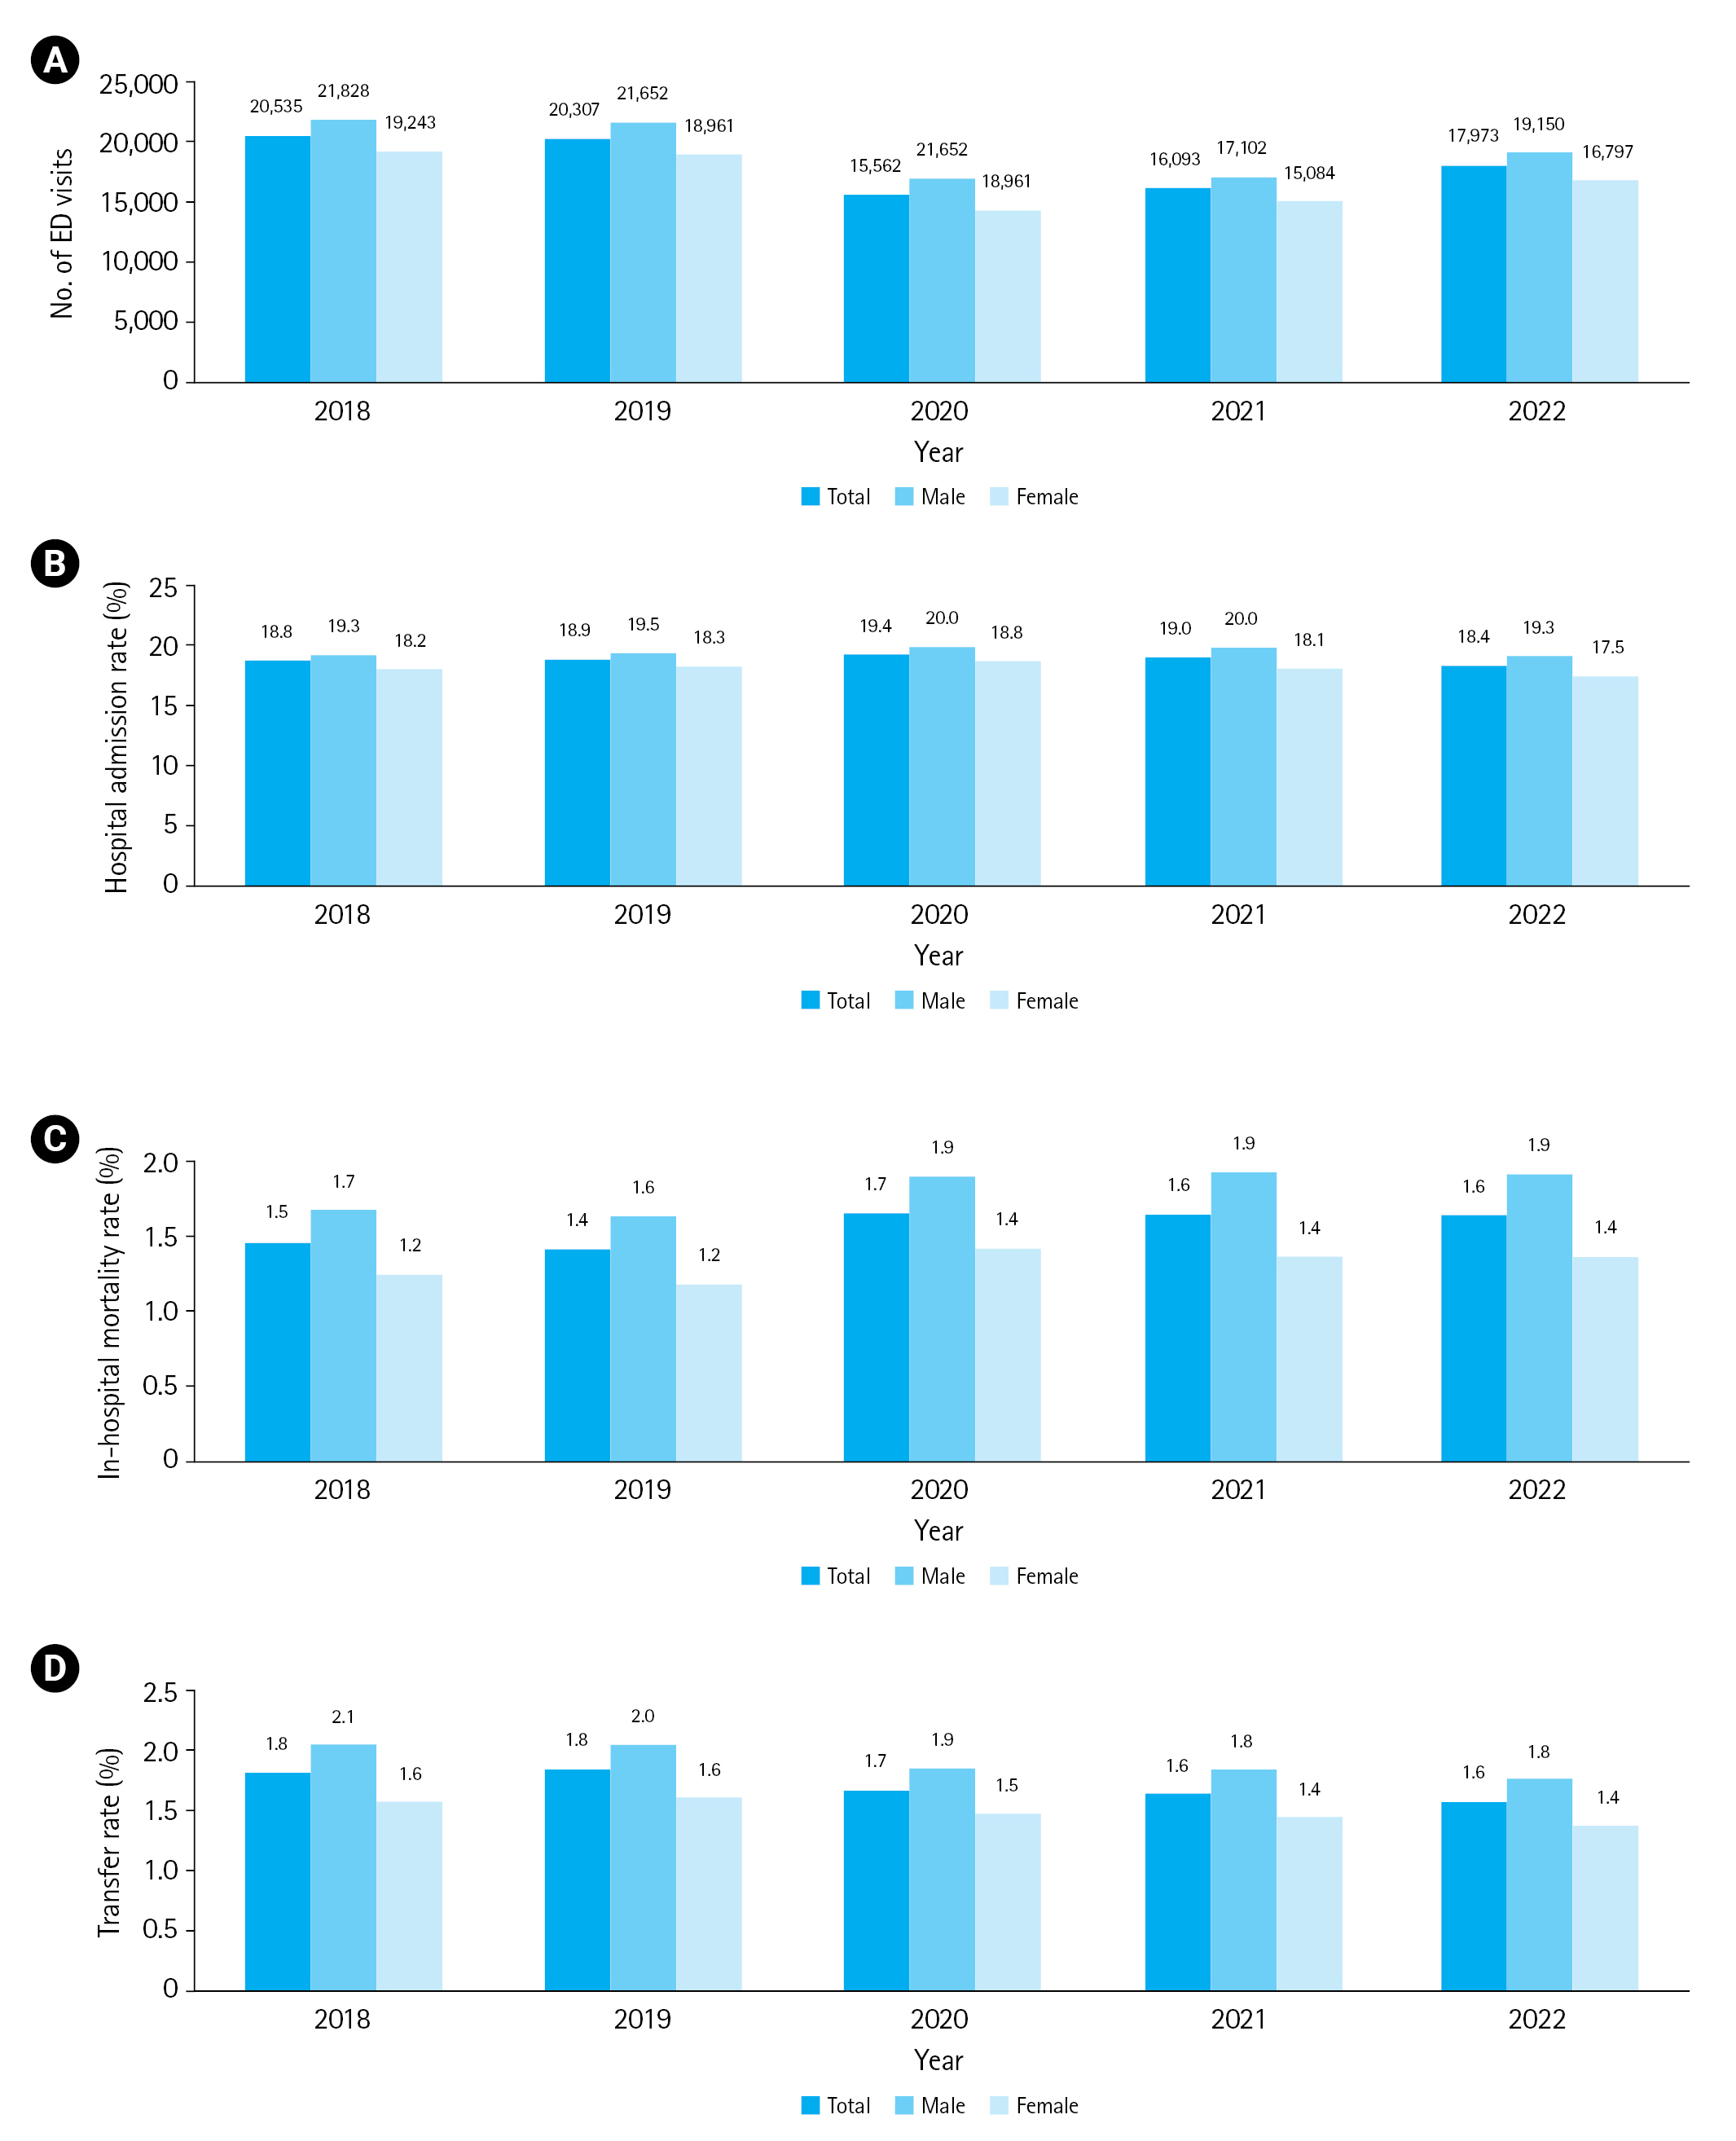
The standardized ED visits per 100,000 population was approximately 20,000 from 2018 to 2019 and decreased to about 18,000 in 2022. The number of ED visits was the lowest in 2020. The standardized mortality rate ranged from 1.4% to 1.7%. The admission rate (18.4%–19.4%) and the transfer rates (1.6%–1.8%) were similar during the study period (Fig. 1).
Patient demographics and visit characteristics
Table 1 shows patient demographics and ED visit information for 5 years of patient visits in the EDs in Korea. Patients 41 to 64 years old most frequently visit the ED. Approximately 91% of patients visit the ED directly. The largest number of patients visited the emergency room between 16:00 and 24:00. Most patients visit the ED with a disease. Approximately 62.4% of injured patients were injured by accident. Korea has its own National Health Insurance, and 87.5% of ED patients have National Health Insurance. Approximately 21.7% of patients visit the ED with an ambulance, while 18.9% of patients were admitted in-hospital from the ED and 0.6% of patients died in the ED. Approximately 5.2% of patients were triaged as KTAS scores 1 or 2.
Approximately 78.3% of patients were discharged from the ED and 90.3% of ED patients stay in the ED for less than 6 hours. As KTAS score increases, the proportion of patients who stay in the ED for more than 6 hours increases.
Common chief complaint and final diagnosis
Table 2 shows the 15 most common chief complaints and most frequently diagnosed diseases. Abdominal pain was the most common chief complaint of patients visiting the ED. Acute gastroenteritis was the most common diagnosis. Respiratory virus symptoms, such as fever and sore throat, were also common chief complaints. Related to the COVID-19 pandemic and increased screening viral tests, “special screening for viral disease,” which is a diagnosis code for screening patients before final diagnosis, also ranked in the top 15 common diagnoses in the ED.
Patient with SIDC and COVID-19
Table 3 shows the demographics, ED visit characteristics, and outcome of patients with SIDC. Approximately 68.9% visit on a weekday and 47.4% of patients with SIDC visit the ED between 8:00 and 16:00. Most patients visit the ED with a disease; 62.4% of injured patients were injured by accident and 24.1% of patients were transferred from another hospital. More than 40% of patients visit the ED with an ambulance. More than 20% of patients were initially triaged as KTAS scores 1 or 2.
Approximately 78.3% of patients were discharged from the ED and 90.3% of ED patients stay in the ED for less than 6 hours. As KTAS score increased, the proportion of patients who stay in the ED for more than 6 hours also increased.
Table 4 shows the ED outcome of patients with SIDC and COVID-19 diagnoses. Intracranial bleeding, subdural bleeding, aortic dissection, severe burns, sepsis, pulmonary embolism, acute respiratory distress syndrome (ARDS), disseminated intravascular coagulation (DIC), acute kidney injury, and postarrest status were responsible for more than 10% of deaths. COVID-19 shows 3.6% of mortality and 33.4% of admission rate.
DISCUSSION
This study provides 5 years of ED visit patient trends based on the NEDIS database in Korea, which has established a strong foundation in emergency medical department management. From 2018 to 2022, patient visits decreased due to the COVID-19 pandemic, while patient admission rates and mortality changed little. Patients with SIDC showed higher KTAS scores, admission rates, and mortality than general patients with other disease codes. This study will be the baseline for further research and implementation of the national emergency medical information system. Reports based on NEDIS, which is a national-wide standardized database, are an important tool for maximizing patient care, reinforcing resource data, and strengthening emergency healthcare systems in Korea and beyond.
NEDIS is useful for evidence-based decision-making and expediting emergency medical assistance. Studies using NEDIS are meaningful because NEDIS covers data from EDs all over the county and therefore ensures standardization of ED data [8,9]. There are several data collection systems in each nation’s EMS system or in certain diseases; however, there are only a few information systems covering EDs all over the country with the same standard [8,9,27–29].
The significant differences in patient visits, admission ratios, and death rates—which were further highlighted during the COVID-19 outbreak—are highlighted by comparison to previous years. Based on the severity of the ailment, the data can be categorized using the KTAS classification to reveal more detailed information about patient visits, such as information on visits and lengths of stays in emergency centers. In addition, our analysis interprets the most common symptom codes, providing a thorough understanding of the patterns in emergency medical centers during the previous 5 years. These data are crucial for directing the distribution and utilization of health resources in the near future.
As shown in Fig. 1, patient visits decreased significantly in 2020. Notably, this was during the COVID-19 pandemic in Korea, when many COVID-19 infections occurred simultaneously in groups such as groups in schools, military, and religious facilities. The government limited the number of gatherings, and isolation was strictly enforced; this created a social atmosphere in which people refrained from going out [30]. The number of COVID-19–infected patients also increased in hospitals, and the frequency of hospital visits decreased due to concerns that people might become infected in hospitals [5,20,31–33]. Among those who visited the emergency medical center, the admission rate and mortality rate increased compared with previous years. An increase in admission and mortality rates indicates a higher rate of severe disease. From this result, it is expected that patients who already had severe disease had their disease worsen or patients with mild symptoms worsened to severe disease due to not being able to visit the hospital during the COVID-19 period.
Patients in the KTAS score 1 and 2 groups often visited the hospital by ambulance, but the rate of ambulance use was also high in the KTAS score 4 and 5 patient groups. Additionally, patients in KTAS score 4 and 5 groups account for a surprisingly high proportion visiting the emergency medical center by transfer from another medical center. Because the severity of disease is relatively low in the KTAS score 5 patient group, the possibility of using an ambulance or requiring transfer is very small. However, many KTAS score 5 group patients were also using ambulances at a high rate, and restrictions against this seem necessary. The same goes for visiting patients who were transferred from other medical centers.
This study shows that the proportion of patients visiting the ED aged 41 to 60 years, including in the KTAS score 1 patient group, was higher than that of elderly patients aged 60 years or older. This can be interpreted as meaning that the onset age for not only mild but also severe diseases is becoming younger and emphasizes the importance of early health checkups in the future.
From 2018 to 2022, respiratory infection symptoms such as fever, sore throat, and myalgia were the most frequent chief complaints of patients visiting the ED. The “special screening examination for other viral diseases” diagnosis, which is the diagnosis code for COVID-19 and other respiratory virus disease screening patients, was a common diagnosis for ED patients for 5 years.
Patients with SIDC have a higher rate of ambulance use, including 119 ambulances. They are also more likely to come to the hospital by transfer than other patients. As a transfer, include a local medical center, which is not an emergency medical center. Further study is needed to identify the reason for the transfer.
Among SIDC, cerebral vascular disease shows a high mortality. ARDS, DIC, and sepsis, which are internal medically critical and rapid-progressing diseases, also show high mortality. COVID-19 showed a relatively lower mortality rate than SIDC; however, it still shows 3.61% mortality and 4.65% of the intensive care unit (ICU) admission rate. As there are some disease categories with a low mortality rate or low ICU admission rate, details of SIDC needs further updating according to its severity, urgency, and incidence. Additionally, diagnostic code–based identification of severe illness needs an update. For example, the burden of sepsis was underestimated because many patients with severe infection requiring organ support are not included by the International Classification of Diseases (ICD) code–based methods [34–36].
As this study provides a trend report of 5-year ED visit information, it might provide an idea of the study based on NEDIS data. For a study using data from NEDIS, harmonization of data formats, standardization of terminology, and establishment of efficient data sharing mechanisms are essential.
There are several limitations to this study. First, this study reports 5-year trends in Korea ED visits. A future study is needed for additional experimental knowledge. However, this study provides visit trends and might provide an idea of the next step of the study. Second, as this study covers a broad view of the trend of ED visits, it does not provide disease-specific details. During the 5 years examined in this study, the COVID-19 pandemic occurred from the end of 2019 to 2022. Additional studies with additional details and variables based on NEDIS may be needed to evaluate the effect of the COVID-19 pandemic on ED visit trends. Finally, SIDC patients were only analyzed based on ED visit information and disposition. As each SIDC has its own characteristics, additional studies are required to evaluate the details of SIDC patient visits and manage trends during ED stays.
This study provides 5-year trends of ED visits in Korea with NEDIS, a national database. The number of patient visits decreased during the 5 years due to the COVID-19 pandemic, while admission, transfer, and death rates were relatively stable. The SIDC diseases showed higher mortality and KTAS than the general population, but the results varied among the types of SIDC. Further study and updates are needed to reflect disease severity, treatment quality, and burden of health care.
NOTES
Conflicts of interest
The authors have no conflicts of interest to declare.
Funding
The authors received no financial support for this study.
Author contributions
Conceptualization: YSR, TK, TGS, SK, HC; Data curation: YSR, EK, JL, SH; Formal analysis: YSR, EK, JL, SH; Visualization: all authors; Investigation: all authors; Methodology: YSR; Supervision: YSR, TGS; Writing–original draft: HHY, HC; Writing–review & editing: all authors. All authors read and approved the final manuscript.
Data availability
Data of this study are available from the National Emergency Medical Center (NEMC) under the Ministry of Health and Welfare of Korea, which were used under license for the current study, and so are not publicly accessible. Data are, however, available from the corresponding author upon reasonable request and with permission from the NEMC.
1. Kim S, Kang H, Cho Y, et al. Emergency department utilization and risk factors for mortality in older patients: an analysis of Korean National Emergency Department Information System data. Clin Exp Emerg Med 2021; 8:128-36.
2. Kim JS, Seo DW, Kim YJ, et al. Prolonged length of stay in the emergency department and increased risk of in-hospital cardiac arrest: a nationwide population-based study in South Korea, 2016-2017. J Clin Med 2020; 9:2284.
3. Pak YS, Ro YS, Kim SH, et al. Effects of emergency care-related health policies during the COVID-19 pandemic in Korea: a quasi-experimental study. J Korean Med Sci 2021; 36:e121.
4. Kim RB, Kim JR, Hwang JY. Epidemiology of myocardial infarction in Korea: hospitalization incidence, prevalence, and mortality. Epidemiol Health 2022; 44:e2022057.
5. Chang H, Kang MW, Paek SH. Impact of the COVID-19 pandemic on emergency department utilization patterns in South Korea: a retrospective observational study. Medicine (Baltimore) 2022; 101:e29009.
6. Hartnett KP, Kite-Powell A, DeVies J, et al. Impact of the COVID-19 pandemic on emergency department visits: United States, January 1, 2019-May 30, 2020. MMWR Morb Mortal Wkly Rep 2020; 69:699-704.
7. Lee SY, Ro YS, Shin SD, Moon S. Epidemiologic trends in cancer-related emergency department utilization in Korea from 2015 to 2019. Sci Rep 2021; 11:21981.
8. Grafstein E, Unger B, Bullard M, Innes G. Canadian Emergency Department Information System (CEDIS) Presenting Complaint List (Version 1.0). CJEM 2003; 5:27-34.
9. Dawson DE. National emergency medical services information system (NEMSIS). Prehosp Emerg Care 2006; 10:314-6.
10. Oh M, Lee JH, Jeon BU, Jeong TO, Heo T, Lee S. Usage patterns of emergency medical services in Korea: analysis of patient flow. Chin Med J (Engl) 2019; 132:259-68.
12. Kim JS, Seo DW, Kim YJ, et al. Emergency department as the entry point to inpatient care: a nationwide, population-based study in South Korea, 2016-2018. J Clin Med 2021; 10:1747.
13. Na SK, Kim JH, Lee WY, Oh MR. Impact of the COVID-19 pandemic on admission and mortality among patients with severe emergency diseases at emergency departments in Korea in 2020: registry data from the national emergency department information system. J Korean Med Sci 2023; 38:e243.
14. Cho ED, Kim B, Kim DH, Lee SG, Jang SY, Kim TH. Factors related to the frequent use of emergency department services in Korea. BMC Emerg Med 2023; 23:73.
15. Jung E, Ro YS, Ryu HH, Shin SD, Moon S. Interaction effects between COVID-19 outbreak and community income levels on excess mortality among patients visiting emergency departments. J Korean Med Sci 2021; 36:e100.
16. Han KS, Jeong J, Kang H, Kim WY, Kim SJ, Lee SW. Association between the emergency department length of stay time and in-hospital mortality according to 28 diagnosis groups in patients with severe illness diagnosis codes. J Korean Soc Emerg Med 2021; 32:77-88.
17. Park YJ, Kim DH, Kim SC, et al. Serum lactate upon emergency department arrival as a predictor of 30-day in-hospital mortality in an unselected population. PLoS One 2018; 13:e0190519.
18. Kim S, Sung HK, Kim T, Ko SK, Kim S, Lee JH. Trends in emergency department visits for suicide attempts before and during the COVID-19 pandemic in Korea: a nationwide study, 2016-2021. J Affect Disord 2023; 331:184-91.
19. Lee SY, Ro YS, Jeong J, Shin SD, Moon S. Impact of the COVID-19 pandemic on the incidence and characteristics of patients with psychiatric illnesses visiting emergency departments in Korea. J Clin Med 2022; 11:488.
20. Cho YS, Ro YS, Park JH, Moon S. Effect of social distancing on injury incidence during the COVID-19 pandemic: an interrupted time-series analysis. BMJ Open 2022; 12:e055296.
21. Min HS, Chang HJ, Sung HK. Emergency department utilization of adult cancer patient in Korea: a nationwide population-based study, 2017-2019. Cancer Res Treat 2022; 54:680-9.
22. Park J, Lim T. Korean Triage and Acuity Scale (KTAS). J Korean Soc Emerg Med 2017; 28:547-51.
23. Park K, Park J, Kwon YD, Kang Y, Noh JW. Public satisfaction with the healthcare system performance in South Korea: universal healthcare system. Health Policy 2016; 120:621-9.
24. Kang K. Analyzing the frequency of emergency room visits and the use of 119 ambulance services. Fire Sci Eng 2020; 34:104-11.
25. Kang K. Visit to the emergency room: a time analysis of 119 ambulances, private cars, and taxis. Fire Sci Eng 2021; 35:81-8.
26. Statistics Korea. Results of the 2020 population and housing census (regarding population and households). Statistics Korea; 2021.
27. Albert M, McCaig LF. Emergency department visits for motor vehicle traffic injuries: United States, 2010-2011. NCHS Data Brief 2015; (185):1-8.
28. Berdowski J, Berg RA, Tijssen JG, Koster RW. Global incidences of out-of-hospital cardiac arrest and survival rates: systematic review of 67 prospective studies. Resuscitation 2010; 81:1479-87.
29. Farley HL, Baumlin KM, Hamedani AG, et al. Quality and safety implications of emergency department information systems. Ann Emerg Med 2013; 62:399-407.
30. Nicola M, Sohrabi C, Mathew G, et al. Health policy and leadership models during the COVID-19 pandemic: a review. Int J Surg 2020; 81:122-9.
31. Chang H, Yu JY, Yoon SY, et al. Impact of COVID-19 pandemic on the overall diagnostic and therapeutic process for patients of emergency department and those with acute cerebrovascular disease. J Clin Med 2020; 9:3842.
32. Kim C, Lee J, Cho Y, et al. The impact of the COVID-19 pandemic on in-hospital mortality in patients admitted through the emergency department. Clin Exp Emerg Med 2023; 10:92-8.
33. Kim D, Jung W, Yu JY, et al. Effect of fever or respiratory symptoms on leaving without being seen during the COVID-19 pandemic in South Korea. Clin Exp Emerg Med 2022; 9:1-9.
34. Angus DC, Bindman AB. Achieving diagnostic excellence for sepsis. JAMA 2022; 327:117-8.
35. Oh S, Mikkelsen ME, O’Connor M, Bowles KH. Why sepsis survivors need an ICD-10 code for “sepsis aftercare”. Chest 2022; 162:979-81.
36. Shankar-Hari M, Phillips GS, Levy ML, et al. Developing a new definition and assessing new clinical criteria for septic shock: for the third international consensus definitions for sepsis and septic shock (Sepsis-3). JAMA 2016; 315:775-87.
Fig. 1.
Age- and sex-standardized data by year. (A) Emergency department visits per 100,000 population. (B) Hospital admissions. (C) In-hospital mortality rates. (D) Transfer rates.
Table 1.
Patient demographics, ED visit characteristics, and outcome by KTAS scores
Values are presented as number (%), unless otherwise indicated. Percentages may not total 100 due to rounding.
ED, emergency department; KTAS, Korean Triage Acuity Scale; SD, standard deviation; IQR, interquartile range.
a) Reporting not obligatory for level III EDs (recording KTAS scores became mandatory starting from 2021). Hence, there is a higher likelihood of missing data for level III EDs.