Chest compression quality, exercise intensity, and energy expenditure during cardiopulmonary resuscitation using compression-to-ventilation ratios of 15:1 or 30:2 or chest compression only: a randomized, crossover manikin study
Article information
Abstract
Objective
Our aim was to compare the compression quality, exercise intensity, and energy expenditure in 5-minute single-rescuer cardiopulmonary resuscitation (CPR) using 15:1 or 30:2 compression-to-ventilation (C:V) ratios or chest compression only (CCO).
Methods
This was a randomized, crossover manikin study. Medical students were randomized to perform either type of CPR and do the others with intervals of at least 1 day. We measured compression quality, ratings of perceived exertion (RPE) score, heart rate, maximal oxygen uptake, and energy expenditure during CPR.
Results
Forty-seven students were recruited. Mean compression rates did not differ between the 3 groups. However, the mean percentage of adequate compressions in the CCO group was significantly lower than that of the 15:1 or 30:2 group (31.2±30.3% vs. 55.1±37.5% vs. 54.0±36.9%, respectively; P<0.001) and the difference occurred within the first minute. The RPE score in each minute and heart rate change in the CCO group was significantly higher than those of the C:V ratio groups. There was no significant difference in maximal oxygen uptake between the 3 groups. Energy expenditure in the CCO group was relatively lower than that of the 2 C:V ratio groups.
Conclusion
CPR using a 15:1 C:V ratio may provide a compression quality and exercise intensity comparable to those obtained using a 30:2 C:V ratio. An earlier decrease in compression quality and increase in RPE and heart rate could be produced by CCO CPR compared with 15:1 or 30:2 C:V ratios with relatively lower oxygen uptake and energy expenditure.
INTRODUCTION
The optimal compression-to-ventilation (C:V) ratio during cardiopulmonary resuscitation (CPR) is still unknown. A 30:2 C:V ratio has been recommended in the international CPR guidelines since 2005 [1,2]. The rationale for the change was to increase the number of compressions, reduce the likelihood of hyperventilation, minimize interruptions in compressions for ventilation, and simplify instructions for teaching and skills retention [1]. However, this recommendation of the 30:2 ratio is based on a consensus of experts rather than clear evidence [2]. Currently, chest compression only (CCO) CPR has also been recommended as an alternative method for untrained laypersons based on animal and clinical observational studies [2,3]. Higher C:V ratios may improve hemodynamics by decreasing interruptions for ventilation and delivering more compressions per minute [4-6]. However, higher C:V ratios or continuous chest compressions may also be associated with increased rescuer fatigue and decreased CPR quality [7-13].
Some investigators have considered a 15:1 C:V ratio, which is the same ratio but with a reduced ventilation number, as an alternative to overcome the problems of the currently recommended 30:2 C:V ratio. In animal studies using a model of ventricular fibrillation arrest, CPR with the 15:1 C:V ratio provided improved or comparable hemodynamics, arterial oxygen profiles, or acid-base balance compared with a 15:2 or 30:2 C:V ratio [14,15]. The 15:1 C:V ratio significantly reduced mean hands-off time compared with the 30:2 C:V ratio in a manikin study [16]. However, little is known about the impact on the quality of chest compressions, exercise intensity, and energy expenditure of the 15:1 C:V ratio compared with the 2 recommended types of CPR.
The aim of this study was to compare the quality of chest compressions, exercise intensity, and energy expenditure during CPR using C:V ratios of 15:1 or 30:2 or CCO.
METHODS
Study design
This study was a randomized, crossover study. This design was chosen to compare the quality of chest compression and exercise intensity of 3 different types of CPR using a manikin model. It carried out at a simulation center in a medical college after being approved by the local research ethics committee at the College of Medicine, The Catholic University of Korea, and conducted in accordance with the Declaration of Helsinki.
Study subjects
Second-year medical student volunteers at the College of Medicine, The Catholic University of Korea, were recruited and enrolled on a first-come, first-served basis. The students had the American Heart Association/Korean Association of CPR Basic Life Support (BLS) provider certificate and were informed about the objectives and protocols of the study through a classroom presentation about participation in the study.
Study protocol
After finishing the informed consent process and pre-study survey, the participants were assessed regarding their physical fitness (maximal oxygen uptake [VO2max], muscle strength, muscle power, endurance, and reactive agility) using a fitness testing system (HIMS M100-D TM; Codisoft, Seoul, Korea) before attending the first CPR experiment.
The first CPR performed by each of the students was randomized by having the students pick up a sealed envelope containing the type of CPR to be performed first. Each student was scheduled for 3 CPR experiments (block randomization generated by a third body) that were separated by at least 1 day as a washout period. They practiced the 3 types of CPR for 3 minutes before starting the 5-minute single-rescuer CPR. The Resusci Anne CPR-D with a Laerdal PC Skill Reporting System (Laerdal, Stavanger, Norway) was used for the experiments. CPR performance on the manikin was transmitted to the computer, and the Laerdal Skill Reporting Software recorded the number of compressions per minute and the depth of sternum depression. An adequate compression was defined as one with a depth of 4–5 cm. Each ventilation performance was simulated for 1 second according to an assistant’s instruction (“breathe in, and breathe out for 1 second”) to minimize individual differences. In the 15:1 C:V ratio group, the rescuer moved quickly from the manikin’s chest to head for a single ventilation, comprising the rescue breath to open the airway with the head tilted, chin lifted, and the nose pinched, and then returned to the chest compression position.
Exercise intensity was evaluated using common subjective and objective measures [17]. The subjective exercise intensity during CPR was measured using the Borg 15-point scale of the ratings of perceived exertion (RPE). The Borg scale of RPE is widely used to monitor exercise intensity and allows individuals to subjectively rate their feelings of exertion during the exercise using a scale from 6 to 20 [18]. The participants were interviewed using the scale at 1-minute intervals during the 5-minute continuous CPR. The objective exercise intensity during CPR was measured using heart rate, VO2max, and energy expenditure. Energy expenditure was calculated using end-expiratory O2 partial pressure, tidal volume, minute ventilation volume, volume of carbon dioxide production per minute, and volume of oxygen consumption per minute. The minute ventilation volume, volume of carbon dioxide production per minute, and volume of oxygen consumption per minute were measured continuously by a gas analyzer (MetaMax 3B; Cortex Biophysik GmbH, Leipzig, Germany). The MetaMax 3B is a wearable cardiopulmonary exercise system for pulmonary gas exchange measurements under real conditions and weighs only 570 g (Fig. 1).
A participant wearing the MetaMax 3B system during the cardiopulmonary resuscitation experiment.
Statistical analysis
The sample size was estimated by the number of subjects (at least 19 participants in each group) used in a previous report to compare CPR using C:V ratios of 15:2 or 30:2 or CCO [12]. We planned to recruit a total of 48 students (24 of each sex) for subgroup analyses. Normally distributed data are presented as mean±standard deviation. Analysis of variance (ANOVA) was used to compare means among the 3 groups after evaluating carryover effects. Multiple comparisons were also performed using Tukey’s method. Data were analyzed using SAS ver. 8.1 (SAS Institute Inc., Cary, NC, USA). A two sided P-value <0.05 was considered statistically significant.
RESULTS
Baseline characteristics of the participants
A total of 48 medical student volunteers (26 men and 22 women) were enrolled in the study. One male student withdrew from the study owing to neck pain. Table 1 shows the baseline characteristics of the 47 participants. The mean age was 22.1±2.3 years. The men were taller and weighed more than the women. Muscle strength and muscle power differed between men and women, but endurance and VO2max did not. Because this study employed a crossover design, all subjects performed all 3 types of CPR: 15:1 and 30:2 C:V ratios and CCO.
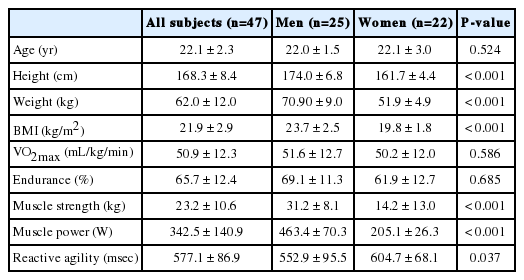
General characteristics of study subjects
Quality of chest compressions
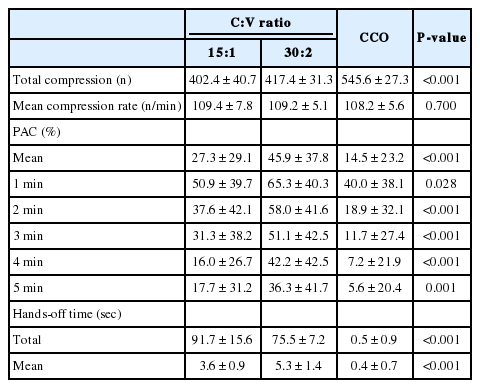
Table 2 shows the number of total compressions, mean compression rate, mean percentage of adequate compression (PAC), and hands-off time for each type of CPR. The number of total compressions in the CCO group was significantly higher than that in the 15:1 or 30:2 group. The number of total compressions in the CCO group increased over time. However, the mean PAC in the CCO group decreased over time and was significantly lower than that in the 15:1 or 30:2 group. A significant difference in mean PAC between the CCO group and the C:V ratio groups was observed from the first minute, and the gap increased over time (Fig. 2A). There was no statistical difference between the 15:1 and 30:2 groups in mean compression rates and mean PAC for 5 minutes.
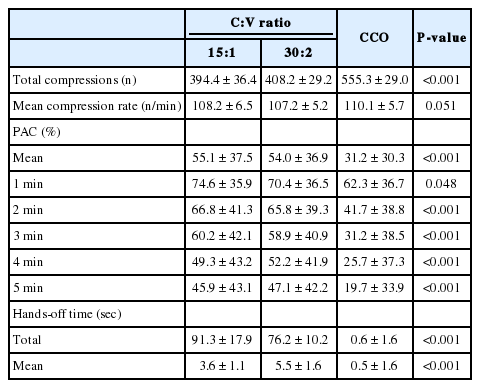
Quality of chest compression for each type of CPR
Time-serial estimated marginal mean plots of percentage of adequate compression for minutes 1 to 5. (A) All participants, (B) men, and (C) women. CCO, chest compression only.
In subgroup analysis, men and women showed different patterns in mean PAC (Tables 3, 4, and Fig. 2B, C). The mean PAC of the CCO group was significantly lower than that of the 15:1 or 30:2 group from the second minute in the male group. However, in the female group, the mean PAC of the 30:2 group was significantly higher than that of the 15:1 or CCO group every minute.

Quality of chest compression for each type of CPR performed by male students
Quality of chest compression for each type of CPR performed by female students
The total hands-off time in the CCO group was much shorter than that of 15:1 or 30:2 group. The total hands-off time in the 15:1 group was slightly longer than that in the 30:2 group (91.3±17.9 vs. 76.2±10.2 seconds). However, the mean hands-off time of the 15:1 group was significantly shorter than that of the 30:2 or CCO group.
Perceived exertion, heart rate, VO2max, and energy expenditure
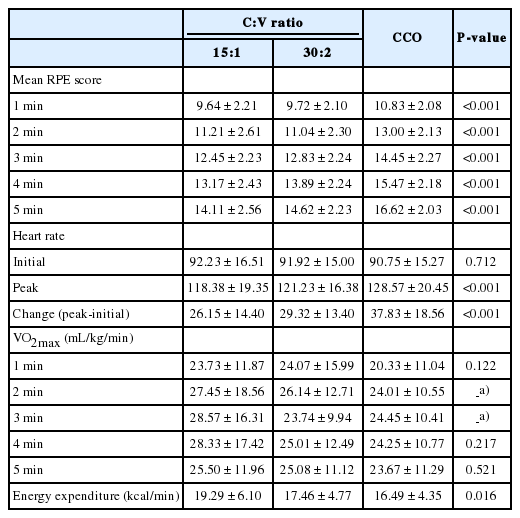
Table 5 shows the mean RPE, change of heart rate, and mean energy expenditure. In all 3 groups, RPE increased over time (Fig. 3A). The mean RPE score of the CCO group was significantly higher than that of the 15:2 or 30:2 group. There were no significant differences in change of heart rate or VO2max in each minute between the 3 groups. However, the mean energy expenditure of the 15:1 group was significantly higher than that of the other 2 groups.
Perceived exertion, heart rate, VO2max, and energy expenditure for each type of CPR
Time-serial estimated marginal mean plots of ratings of perceived exertion for minutes 1 to 5. (A) All participants, (B) men, and (C) women. CCO, chest compression only.
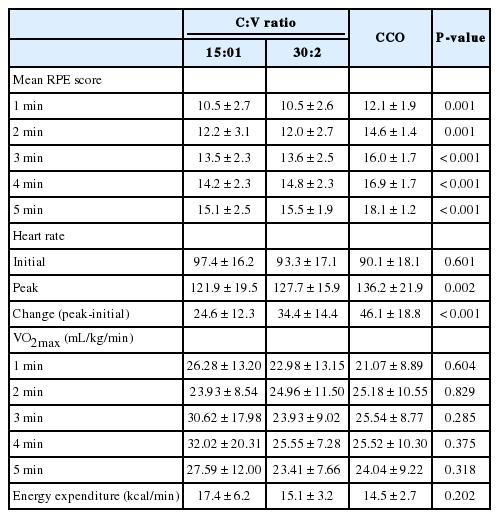
In subgroup analysis, men and women showed slightly different patterns in mean RPE (Tables 6, 7, and Fig. 3B, C). The mean RPE of the CCO group was also significantly lower than that of the 15:1 or 30:2 group from the first minute in the male and female groups. In the male students, there were no significant differences in changes in the heart rate and VO2max among the 3 types of CPR. However, in the female students, the change in heart rate (peak heart rate minus initial heart rate) in the CCO group was significantly higher than that in the 15:1 or 30:2 group (Tables 6, 7).

Perceived exertion, heart rate, VO2max, and energy expenditure for each type of CPR performed by male students
Perceived exertion, heart rate, VO2max and energy expenditure for each type of CPR performed by female students
DISCUSSION
The aim of this exploratory crossover manikin study was to compare the quality of chest compressions, exercise intensity, and energy expenditure of the 3 types of 5-minute single-rescuer CPR (15:1 C:V ratio vs. 30:2 C:V ratio vs. CCO CPR). In this study, we found that the mean compression rates for 5 minutes were not significantly different between the 3 groups. The 15:1 C:V ratio was comparable with the 30:2 C:V ratio with respect to mean PAC, RPE, change of heart rate, and VO2max at every minute during the 5-minute CPR. However, in the CCO group, the mean PAC was significantly lower than that of the 2 C:V ratio groups, and the difference developed within the first minute. Interestingly, the mean PAC for 5 minutes in female students in the 30:2 group was significantly higher than that in the 15:1 or CCO group. The RPE score in each minute and heart rate change of the CCO group was significantly higher than that of the 2 C:V ratio groups. There were no significant differences in VO2max between the 3 groups. Energy expenditure in the CCO group was relatively lower than that of the 2 C:V ratio groups.
15:1 vs. 30:2 C:V ratio
In recent decades, many different C:V ratios have been studied, and the current 30:2 ratio has been recommended in the international CPR guidelines since 2005 based on a consensus among experts. Although many experimental studies using animal or manikin models and some clinical observational studies have supported that the 30:2 C:V ratio is superior to the previously recommended C:V ratio of 15:2, there is no definitive study to confirm the clinical efficacy of the 30:2 C:V ratio [12,19-29].
An increased C:V ratio has some advantages such as increasing the number of compressions per minute, minimizing interruptions in chest compressions for ventilation, and reducing the likelihood of hyperventilation. However, some investigators have expressed concerned about a faster decrease in the quality of CPR as a result of increased fatigue or exhaustion of the rescuer. Greingor [10] reported a significant decrease in compression quality over time for a ratio of 15:2 compared with 5:1. In this manikin study, compression of insufficient depth was 2.2 times more frequent with a ratio of 15:2 than with a ratio of 5:1. In our previous manikin study comparing C:V ratios of 15:2 and 30:2, the mean PAC for 5 minutes was significantly different between the 30:2 and 15:2 groups [30]. A significant reduction in the mean PAC over time was found in the 30:2 group. Especially, from the third minute, the fatigue score in the 30:2 group was significantly higher than in that of the 15:2 group, and mean PAC of the 30:2 group was significantly lower than that of the 15:2 group [30]. Thus, further studies are needed to understand the exercise intensity of each type of CPR and to define the best method for coordinating chest compressions and ventilations during CPR.
Physiological and mathematical simulation studies suggested that 15:1, 20:1, or 30:2 would be the best C:V ratio to maximize blood flow and oxygen delivery [31,32]. A C:V ratio that could provide similar hemodynamics and oxygenation profile of the current 30:2 C:V ratio and minimize rescuer’s fatigue would be an ideal C:V ratio. Because chest compression work is a major contributing factor to the rescuers’ fatigue or exhaustion during CPR, reducing the number of ventilations without changing the C:V ratio would be a candidate for an optimal C:V ratio. Yannopoulos et al. [14] and Yannopoulos et al. [19] demonstrated in their serial animal experiments that the 15:1 or 30:2 ratio improved hemodynamics and vital organ perfusion by reducing intratracheal pressure compared with the 15:2 C:V ratio. Hwang et al. [15] also demonstrated that the 15:1 ratio was comparable to a 30:2 ratio with respect to hemodynamics, oxygenation, and acid-base balance in an animal experiment. For 2 C:V ratios providing similar hemodynamics and oxygenation profile, the clinical efficacy would depend on the CPR performance of the rescuer during each type of CPR. The performance of adequate CPR is influenced by many factors such as the number of rescuers, the CPR duration, and the rescuer’s physical fitness, age, sex, body mass index, and fatigue. In a previous crossover manikin study in which compression and ventilation variables were measured simultaneously, compression rate and depth were similar between the 30:2 and 15:1 C:V ratio groups [16]. Although the study had critical limitations in that the washout time was too short (5 minutes) and the CPR sequence of the 2 C:V ratios was not randomized, the mean hands-off time was significantly different between the 30:2 and 15:1 C:V ratio groups (9.3 vs. 6.7 seconds) [16]. In our study also involving BLS-certified medical students, the mean hands-off time of the 15:1 group was also shorter than that of the 30:2 group, but the total hands-off time for 5 minutes in the 15:1 group was significantly longer than that of the 30:2 group owing to the frequent change of compression to ventilation. In our study, which tried to minimize individual variation of ventilation, the mean compression rates and mean PAC for 5 minutes were not significantly different between the 2 C:V ratio groups. Furthermore, exercise intensity, which was evaluated using the Borg RPE score, the change in heart rate and VO2max were also not significantly different between the 2 C:V ratio groups. These findings support that the quality of chest compressions and exercise intensity in CPR using a C:V ratio of 15:1 may be comparable to those in CPR using a 30:2 C:V ratio.
Interestingly, although number of chest compressions was similar between 2 C:V ratio groups, the mean PAC and change in heart rate of female students in the 30:2 group was significantly higher than those in the 15:1 group in each minute for 5 minutes. In our previous manikin study comparing different compression numbers with the same number of ventilation in 5-minute single rescuer CPR, female medical students in the 30:2 group showed significantly lower total mean PAC than that of the 15:2 group (31.0±27.2% vs. 62.8±32.2%, P=0.003), and a similar trend was observed between the 2 C:V ratio groups in each minute for 5 minutes [30]. In the current study in which ventilation was only simulated, the total mean PAC of female students in the 30:2 group (45.9±37.8%) was higher than that (31.0±27.2%) of the 30:2 group in our previous study but lower than that (61.1±35.4%) of male students in the 30:2 group.
Thus, we hypothesized that compression work could affect the CPR performance of female students. Although the total number of compressions and mean RPE scores during 5 minutes were not significantly different between the 2 C:V ratio groups, the mean PAC in the female student group indicates that they could not adequately perform the chest compression. Higher muscular exertion owing to the frequent changes in position and relatively shorter inter-compression pauses in the 15:1 group could account for this result. Thus, further studies focusing on female rescuers are needed to clarify the findings.
Chest compression is known as a moderately intense physical activity with metabolic costs that correspond to that of other physical activities such as recreational cycling or swimming [33]. The exercise intensity according to a subjective measure like RPE score and an objective measure like VO2max of the 2 C:V ratio groups in our study was also categorized as moderate. However, the energy expenditure during the 2 types of CPR was considerably high in our study. According to this objective measure, CPR could be categorized as a vigorous activity (more than 6.0 metabolic equivalents or 7 kcal/min) such as jogging, running, aerobic dancing, or bicycling 10 miles per hour or faster [34,35]. Although VO2max did not significantly differ between the 2 C:V ratio groups, the mean energy expenditure in the 15:1 group was higher than that of the 30:2 group. This result may also be due to the more frequent changes in position and relatively shorter inter-compression pauses. Furthermore, because only one ventilation was required at a cycle, the participants could provide a forceful effort for ventilation in the 15:1 C:V ratio group.
15:1 vs. 30:2 C:V ratio vs. CCO CPR
The mean PAC and mean RPE score in the CCO group was significantly different from those of the 2 C:V ratio groups from the first minute of the 5-minute CPR in our study. Although the number of compressions increased over time, the mean PAC decreased progressively during the 5-minute CPR in the CCO group. The reason for this rapid decline of the mean PAC in the CCO group could be explained by the relatively higher rescuer’s fatigue. In our study, the RPE scores, a subjective measure of exercise intensity, of the CCO group was significantly higher than those of the 15:1 or 30:2 group. Our results are consistent with those of many previous studies. In the study of Ashton et al. [8], the number of satisfactory chest compressions performed decreased during continuous chest compressions over 3 minutes. Hightower et al. [7] and Ochoa et al. [9] also reported the percentage of correct chest compressions decreased significantly after 1 minute during 5 minutes of closed chest compression. In a randomized crossover manikin study involving only female BLS-certified volunteers, the PAC values were significantly lower in the CCO group than in the 30:2 group (59.9±19.1% vs. 72.5±14.8%, P=0.05) during the 10-minute single-rescuer CPR [13]. In a manikin study comparing C:V ratios of 15:2 and 30:2 and CCO in CPR performed by lay rescuers, the mean compression depth in the CCO group was also significantly lower than that of the 15:2 or 30:2 group [12]. For these reasons, many investigators have suggested a 1-minute switching interval [8,13,36]. Although some investigators have asserted that a 2-minute CCO CPR is tolerable, we also suggest that it is optimal to rotate rescuers every minute when performing CCO CPR to provide high-quality CPR.
According to the RPE score, CCO CPR would be categorized as a vigorous activity, especially from 3 minutes. However, VO2max and energy expenditure of the CCO group was relatively lower than the 2 C:V ratio groups in our study. These results did not correlate with the differences in the RPE score among the 3 groups. This discrepancy may be because there was no ventilation effort during CCO CPR and because we used indirect calorimetry to measure energy expenditure from volume of oxygen consumption per minute consumption and CO2 production. Pierce et al. [37] also suggested that investigating CPR demands based on central (respiratory-metabolic) measures may underestimate or overestimate actual individual demands and asserted that a peripheral measure such as RPE score is more important and that physical fitness level may be a limiting factor in the ability to perform CPR for extended periods of time. In our study, the objective measures such as VO2max or energy expenditure may also be overestimated because ventilation was simulated. Thus, further study to evaluate the changes in the objective measures of exercise intensity during each type of CPR is required.
Our study has some limitations. First, CPR on a manikin model does not perfectly represent clinical CPR. Thus, we assume the results with real patients would be different. Second, although the MetaMax 3B system was a relatively small and light device, the participants’ performance while wearing this system could be different from real CPR performance. Third, we used 4 to 5 cm as an optimal compression depth. This range was lower than the current guidelines target (≥5 cm). However, in a recent large observational study, Stiell et al. [38] reported that the depth interval for maximum survival was 40.3 to 55.3 mm (peak 45.6 mm) and suggested the current guidelines target may be too high. Thus, our results using the similar target interval of that study may provide an additional insight to determine the optimal C:V ratio. Furthermore, the Hawthorne effects may have affected our results, because the participants were certainly aware that their CPR performance was being observed and recorded.
In conclusion, CPR with a 15:1 C:V ratio may provide a quality of chest compression and exercise intensity comparable to that with a 30:2 C:V ratio. An earlier decrease in the quality of chest compressions, an increase in perceived exertion, and a significant change in heart rate may be produced by CCO CPR compared with CPR using 15:1 or 30:2 C:V ratios with relatively lower oxygen uptake and energy expenditure.
Notes
No potential conflict of interest relevant to this article was reported.
References
Article information Continued
Notes
Capsule Summary
What is already known
Higher compression-to-ventilation (C:V) ratios may improve hemodynamics by decreasing interruptions for ventilation and delivering more compressions per minute. Higher C:V ratio or continuous chest compressions may also be associated with increased rescuer fatigue and decreased cardiopulmonary resuscitation (CPR) quality. In animal studies using a model of ventricular fibrillation arrest, CPR with the 15:1 C:V ratio provided improved or comparable hemodynamics, arterial oxygen profiles, or acid-base balance compared with a 15:2 or 30:2 C:V ratio. The 15:1 C:V ratio significantly reduced mean hands-off time compared with the 30:2 C:V ratio in a manikin study.
What is new in the current study
CPR using a 15:1 C:V ratio may provide a compression quality and exercise intensity comparable to those obtained using a 30:2 C:V ratio. An earlier decrease in compression quality and increase in ratings of perceived exertion and heart rate could be produced by chest compression only CPR compared with 15:1 or 30:2 C:V ratios with relatively lower oxygen uptake and energy expenditure.