Characteristics of pediatric emergency department visits before and during the COVID-19 pandemic: a report from the National Emergency Department Information System (NEDIS) of Korea, 2018–2022
Article information

Abstract
Objective
As of 2018, approximately 1.2 million pediatric patients visited emergency departments (EDs) in Korea, showing a steady increase. Given the distinct differences between children and adults, it is vital to examine the epidemiological characteristics of pediatric patients visiting the ED.
Methods
This study retrospectively analyzed the ED use patterns of pediatric patients <18 years old in Korea from January 1, 2018, to December 31, 2022, using data from the National Emergency Department Information System (NEDIS).
Results
Most pediatric ED patients were boys, with an average age of 6.6±5.3 years. Patients younger than 1 year and those in critical condition had longer ED stays and more frequently required hospital admission and used the 119-ambulance service. The primary symptom was fever, and the most common discharge diagnosis was gastroenteritis. Following the declaration of the COVID-19 pandemic in 2020, ED visits decreased by 49%. Meanwhile, there was an increase in in-hospital mortality rate/age- and sex-standardized mortality rate per 100,000 ED visits, Admission and transfer rates remained similar between before and after the start of the pandemic.
Conclusion
Through this analysis, we identified the characteristics of pediatric patients visiting EDs in Korea. We observed a sharp decline in ED visits after the start of the COVID-19 pandemic. From there, ED visits slowly increased but remained below prepandemic levels for 3 years. This research will serve as a foundational resource for appropriately allocating and preparing pediatric ED resources.
INTRODUCTION
As of 2018, the number of pediatric patients visiting emergency departments (EDs) in Korea was approximately 1.2 million, and this figure has increased each year since, accounting for about 10% of all ED visits [1,2]. It is crucial to understand that children are not simply “small adults”; instead, they have distinct structural, immunological, sociopsychological, and disease-related features.
Younger children are immunologically more vulnerable to external factors like viruses than adults, and they more easily contract infectious diseases such as respiratory diseases or gastroenteritis. In one study [3], the rate of ED visits among preschool children exceeded 40% during an epidemic of influenza. We already know that respiratory pandemic diseases such as Middle East respiratory syndrome (MERS) have a significant impact on the use of EDs by febrile children [4]. A child’s head is also relatively heavy, and unlike adults, their limbs cannot be used well, so their bodies have structural characteristics that render them susceptible to external environmental factors or trauma. Additionally, their use of hospitals is heavily influenced by decisions made by parents or caregivers, making it imperative to understand pediatric ED usage patterns.
In March 2020, the World Health Organization (WHO) declared a pandemic due to the spread of a novel coronavirus variant. There are well-documented studies from countries such as the United States, Japan, and Europe that show a significant decrease in pediatric ED visits after the initiation of social distancing measures in March 2020 due to the COVID-19 outbreak [5–10]. In Korea, ED visits decreased noticeably across all age groups after the start of the COVID-19 pandemic [11,12], and pediatric ED visits in particular also declined according to data from several hospitals and national data [13–16]. In other words, these studies show that the number of pediatric patients visiting the ED was influenced by the COVID-19 pandemic in Korea.
This study aims to use the National Emergency Department Information System (NEDIS) data to ascertain and analyze the epidemiological patterns of pediatric ED visits from 2018–2022, thereby serving as foundational data for the appropriate allocation of medical resources for pediatric emergency care.
METHODS
Ethics statement
This study was approved by the Institutional Review Board of the National Medical Center of Korea (No. 2023-08-094). The requirement for informed consent was waived due to the retrospective nature of the study.
Study design and population
This study targets all pediatric patients <18 years of age who visited Korean emergency medical institutions and were registered in the NEDIS data. Using these data, we collected and analyzed emergency information from pediatric patient records transmitted to NEDIS between January 1, 2018, and December 31, 2022.
Data source and measures
In 2000, based on the Emergency Medical Care Act, the Korean government established the National Emergency Medical Center (NEMC; Seoul, Korea), which receives various types of ED data daily from emergency medical institutions nationwide. Funded by the Korean government, NEMC primarily focuses on establishing the foundation for an emergency medical system, maintaining medical quality, and improving the emergency medical service (EMS) system. Furthermore, it collects data from designated EDs and uses them as foundational data for research and policy establishment. In terms of scale, Korea's emergency medical institutions are categorized as level I, II, or III institutions. All these institutions operate with national approval, transmitting their data electronically via the NEDIS, which then consolidates them into a form of big data. This ED information transmission network, introduced in 2003, initially had only a few EDs participating. However, according to NEDIS statistical reports, there were 401 participating institutions in 2019 [1] and 398 in 2021 [2], all of which are currently contributing their data to NEMC.
We investigated the age and sex of pediatric patients, classifying them into the following four age groups: <1, 1–6, 7–12, and 13–17 years. We also identified the type of institution they visited (level I, II, or III). We then examined the time that elapsed from the onset of symptoms to their ED visit, the day of their ED visit (weekday, weekend or holiday), and the time of their ED visit. Visiting times were categorized into daytime (8:00–16:00), evening (16:00–24:00), or nighttime (24:00–8:00 the next day). We investigated the presence of diseases, categorizing patients into disease, injury, dead on arrival, other, or unknown. Injury cases were further categorized into accidents, suicide, violence, other, or unknown. Patient insurance types were categorized as National Health Insurance, automobile insurance, occupational health and safety insurance, private insurance, medical aid type 1 and 2, general insurance, other, or unknown. The route of arrival was classified into direct arrival, transfer from another hospital, referral from the outpatient department, other, or unknown. Modes of arrival included 119 ambulance, other medical institution ambulance, other ambulance, police or other official vehicle, air transport, other ground transport, walk-in, other, or unknown. Initial severity at the time of visit was categorized according to the Korean Triage and Acuity Scale (KTAS) scores into 1 (resuscitation), 2 (emergency), 3 (urgent), 4 (semi-urgent) and 5 (nonurgent), and other or unknown, with scores 1 and 2 cases being defined as severe. The mean and median of ED length of stay (LOS) were calculated and categorized as 0–6, 6–12, 12–24, ≥24 hours, or unknown. Patients were classified by ED outcome (disposition; discharge, hospitalization, transfer, hopeless discharge, death, other, or unknown) and hospital discharge (disposition; discharge, transfer, hopeless discharge/discharge, death, other, or unknown). Using the International Classification of Diseases, 10th Revision (ICD-10), one main diagnosis code entered upon discharge from the ED was analyzed and classified into diseases and injuries. Patients whose diagnosis at the time of discharge corresponded to one of 28 severe illness diagnosis codes (Supplementary Table 1) were classified as having severe emergency illness. The frequency of one main symptom and one ED diagnosis code entered in the medical record chart was checked.
Age- and sex- standardized ED visits per 100,000 people by year were divided into total, boys, and girls. Similarly, the in-hospital mortality rate/age- and sex- standardized mortality rate per 100,000 ED visits was analyzed. Hospital admission rate and transfer rate by sex were also calculated for each year.
Statistical analysis
Database construction and statistical analysis were performed using SAS ver. 9.4 (SAS Institute). Statistics are expressed using frequency, percentage, mean, standard deviation, or median values. The chi-squared test was used to compare age, visit method, treatment results, diagnosis, and KTAS scores according to visit time.
The age- and sex-standardized incidence rates of pediatric ED visits per 100,000 people per year were calculated using the 2020 mid-year census population in the Korean Statistical Information Service (KOSIS) database from Statistics Korea (Daejeon, Korea). The significance level α was set at 5%, and P<0.05 was defined as statistically significant.
RESULTS
Demographic data
This study enrolled a total of 6,640,995 participants (56.9% male) with an average age of 6.6±5.3 years. The most frequent age group for hospital visits was 1–6 years, accounting for 49.0% of all pediatric visitors. The median time from symptom onset to hospital visit was 237 minutes (interquartile range [IQR], 60–1,223 minutes) among a total of 4,847,338 patients who could be assessed.
Hospital visits were more common on weekdays (54.4%) than on weekends. The peak visiting hours were between 16:00 and 24:00 (56.0%), followed by between 8:00 and 16:00 (26.4%) and between 24:00 and 8:00 the next day (17.6%). Level II medical facilities were most often frequented (47.0%). Disease accounted for 62.0% of all ED cases, while injuries composed 32.1%, with accidents being the most common cause of injury at 74.8%. National Health Insurance covered 94.6% of all visits.
The most common mode of arrival was direct admission, with personal vehicles being the predominant means of transportation. The distribution of KTAS scores was as follows: KTAS score 1, 0.2%; KTAS score 2, 2.5%; KTAS score 3, 28.5%; and KTAS scores 4–5, 60.2%. This distribution indicates that most cases were minor. Meanwhile, severe emergency conditions were identified in 3.1% of cases. The average ED stay was 110.9±157.8 minutes, with a median of 64 minutes (IQR, 26–140 minutes), and 95.2% of visits had a duration of 0 to 6 hours. Most emergency treatments resulted in discharge (89.9%), and the hospital dispositions also primarily (98.9%) ended in discharge (Table 1).
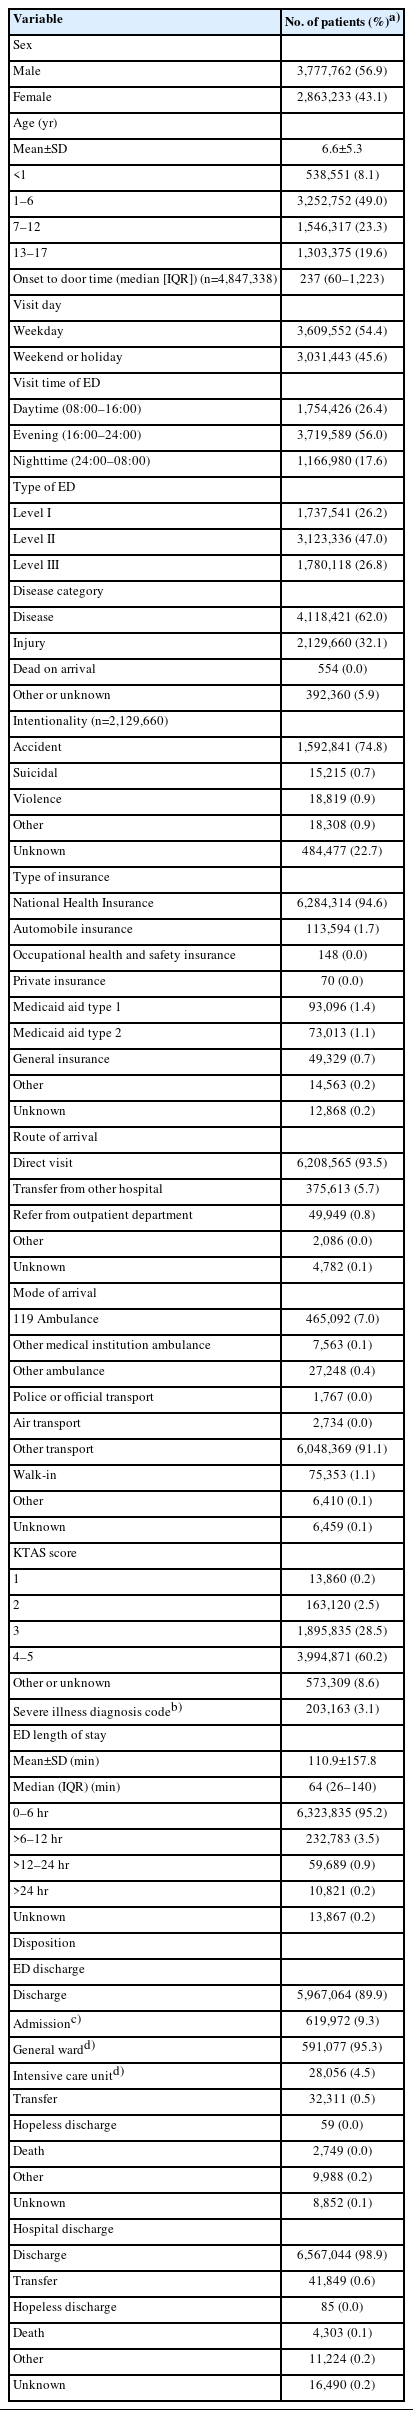
Demographic data of children who visited the EDs in Korea from 2018–2022 (n=6,640,995)
Demographic data by KTAS score
Patients with KTAS scores of 1–2 had a mean age of 3.7±5.2 years, rendering them younger than those with other KTAS scores. Boys outnumbered girls across all KTAS score groups. Weekday visits were predominant in all scores, excluding those categorized as "other or unknown." Level II EDs received the most patients, regardless of KTAS score. For disease classification, a greater proportion of severe cases (KTAS scores 1–2) presented due to diseases compared to nondisease causes, whereas the ratio of nondisease presentations was increased among patients with lower KTAS scores. Among nondisease cases, unintentional accidents were the most prevalent. National Health Insurance was available for 94.6% of patients across all KTAS score groups. As the severity decreased, the use of EMS decreased, and patients classified with any of 28 severe emergency conditions were most common (23.8%) in the KTAS scores 1–2 group. Generally, lower acuity was associated with a shorter ED stay, with the majority spanning 0 to 6 hours. Most ED outcomes were discharges (89.9%), followed by hospitalizations (9.3%), transfers (0.5%), and other outcomes (0.2%). Higher acuity correlated with greater rates of hospitalization and transfer. The predominant final treatment outcome was discharge (98.9%) (Table 2).
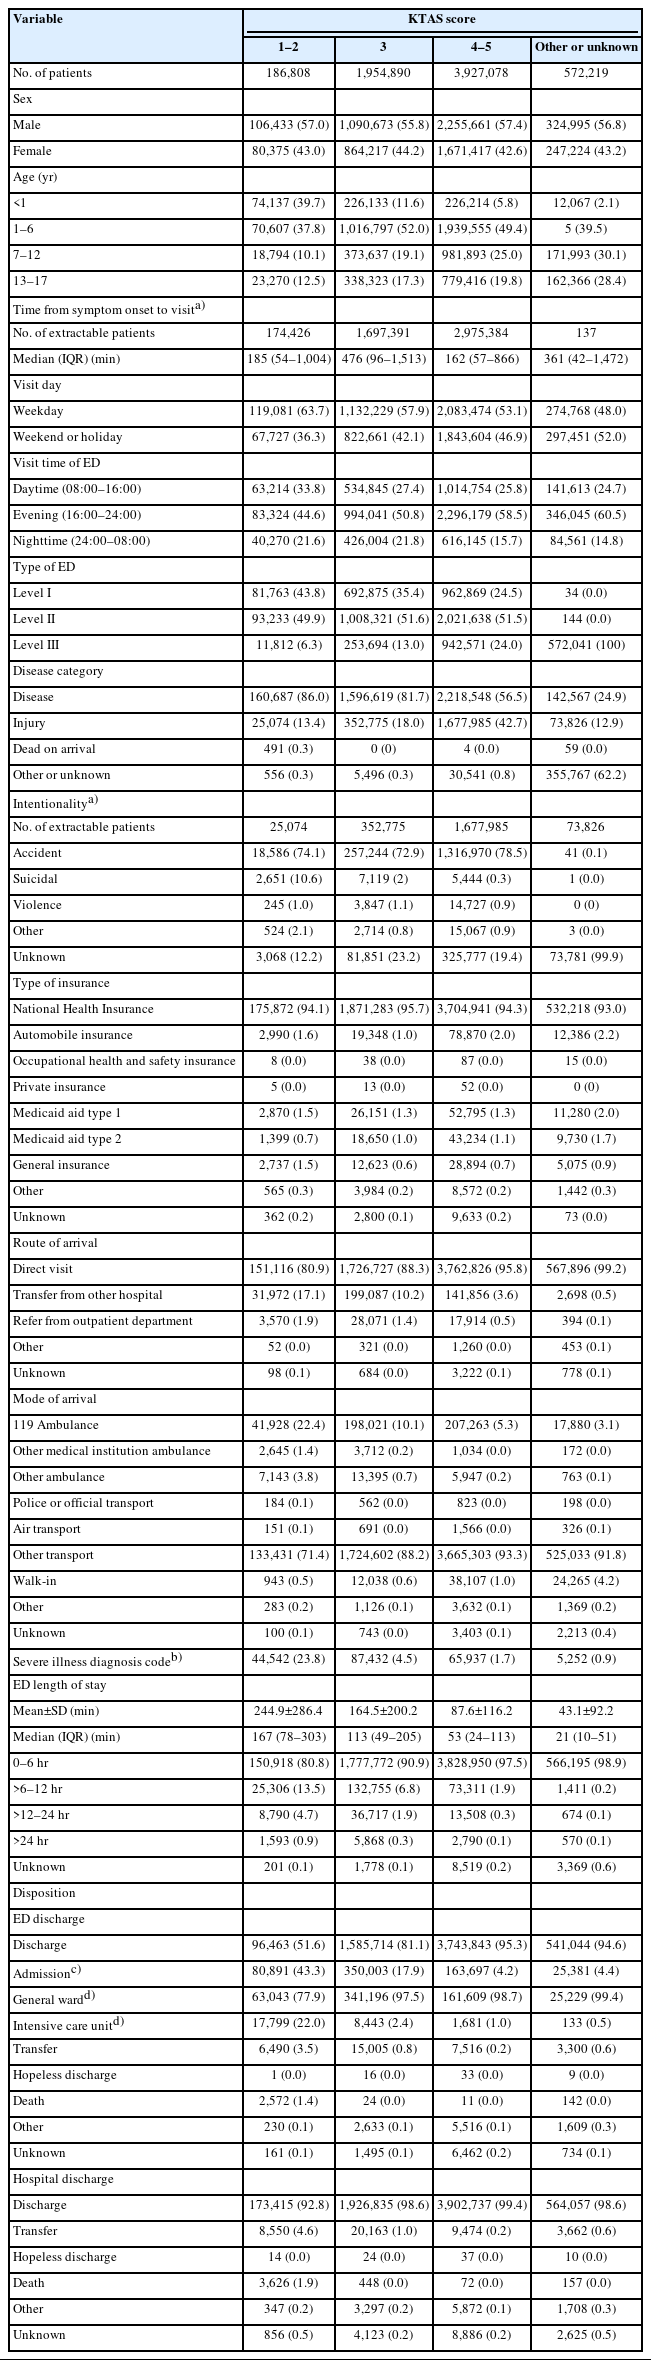
Demographic data by KTAS scores (n=6,640,995)
Demographics data by age
Participants were categorized into the following age groups: <1, 1–6, 7–12, and 13–17 years. Across all age groups, boys outnumbered girls. For the 4,847,338 individuals for whom the onset-to-presentation time could be ascertained, infants (<1 year of age) had the longest median time at 364 minutes (IQR, 80–1,440 minutes). Hospital visits were more frequent on weekdays across all age groups. The peak visiting hours were 16:00 to 24:00.
Level II medical institutions were consistently the most frequented institutions across all ages, with level I facility use being highest (42.6%) among infants and lowest (17.9%) among those aged 13–17 years. Level III facility use increased with age, rising from 6.9% in infants to 39.8% in those aged 13–17 years.
Younger children presented to the ED primarily due to diseases, while older children increasingly visited for nondisease reasons. Among nondisease presentations, unintentional accidents were predominant across all age groups. Self-harm and suicide-related visits were notably higher (3.6%) in patients aged 13–17 years. National Health Insurance was the most common across all age groups.
A direct ED visit was the most common mode of presentation across all age groups, but infants had a higher-than-average rate of external transfers (13.2%). Personal vehicles were the primary means of transportation, followed by the 119-ambulance service.
Among infants, the frequencies of having KTAS scores of 1, 2, and 3 were higher than average at 0.4%, 13.3%, and 42.0%, respectively. In contrast, those aged 7–12 years had a greater proportion of minor cases among those with KTAS scores of 4–5 (63.5%). Severe emergency conditions were most common in the infant category at 10.1%.
ED LOS predominantly lasted 0 to 6 hours, but the duration of ED LOS was notably shorter for older children. Most ED outcomes resulted in discharge, with the hospitalization rate being highest for infants (22.7%) among all age groups. Final treatment outcomes primarily ended in discharge across all age groups, with a notably higher rate of transfer to other hospital for infants (1.1%). The death rate was highest in infants at 0.2% compared to 0.1% in those aged 13–17 years (Table 3).
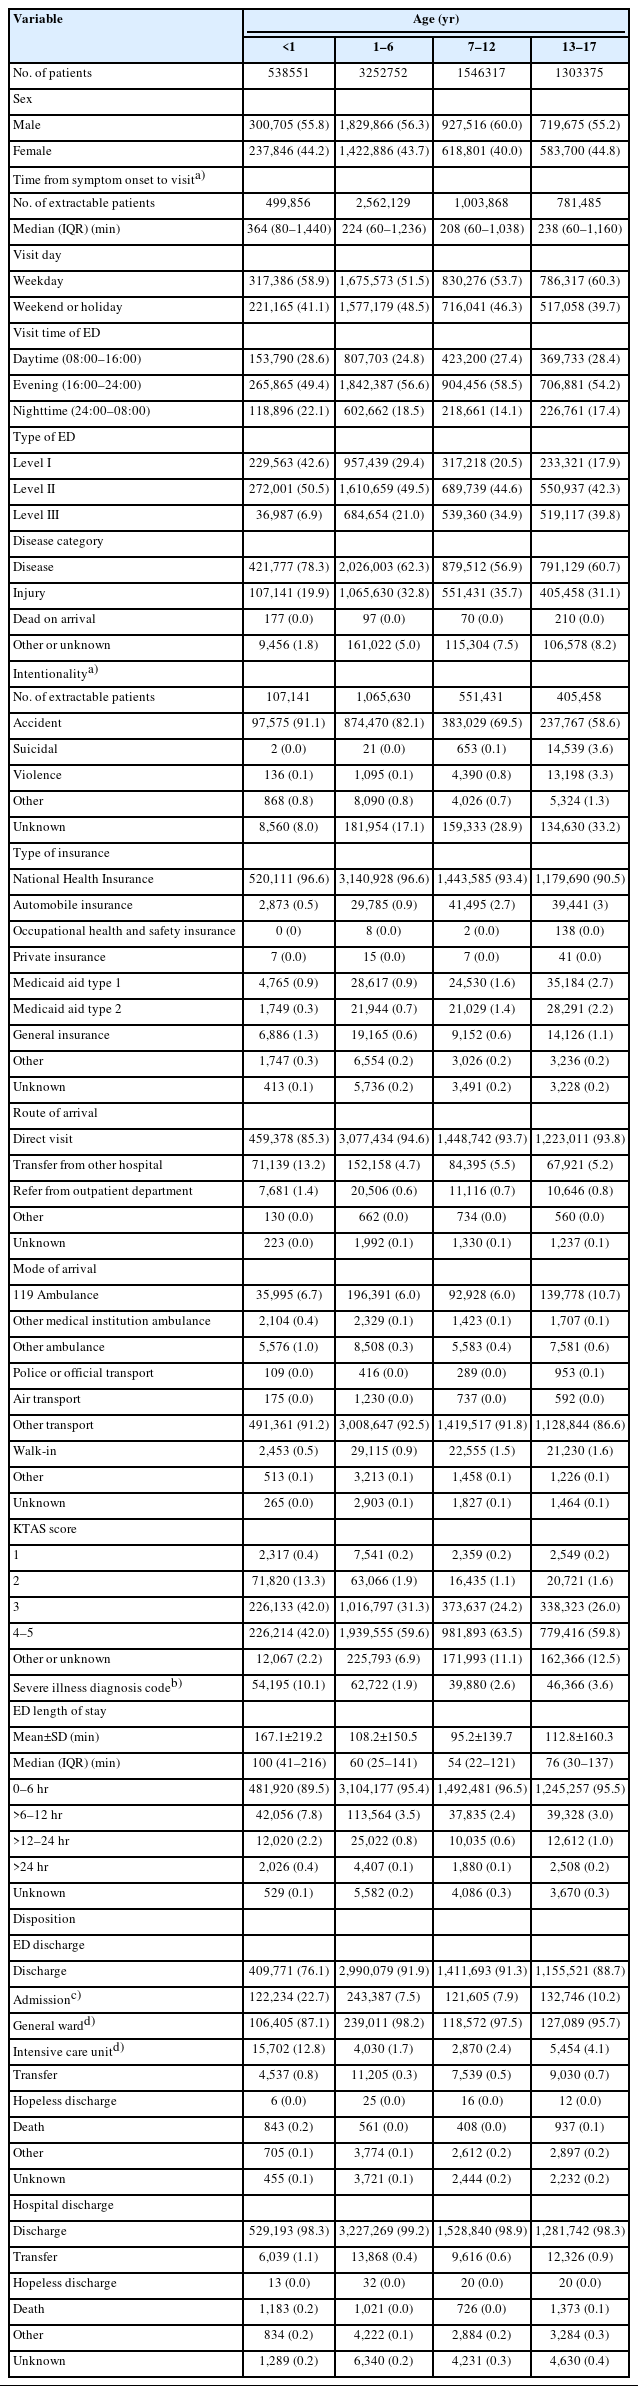
Demographic data by age groups (n=6,640,995)
Trends in pediatric ED utilization
During 2018–2022, when examining the annual age- and sex-standardized incidence rate per 100,000 people, the rates for the 2 years (2018 and 2019) preceding the emergence of COVID-19 were 24,360 and 23,085, respectively. In 2020, with the beginning of the COVID-19 pandemic, the rate dropped to 11,773—a decline of approximately 49%—before displaying a gradual uptrend to 11,311 in 2021 and 15,065 in 2022. Specifically for boys, the rate decreased from 25,800 in 2019 to 13,239 in 2020, marking a drop of approximately 48.7%, but it gradually increased thereafter. For girls, the rate dropped from 20,371 in 2019 to 10,308 in 2020, showing a decline of roughly 49.4%, before rising to 9,860 in 2021 and then to 13,178 in 2022 (Fig. 1).
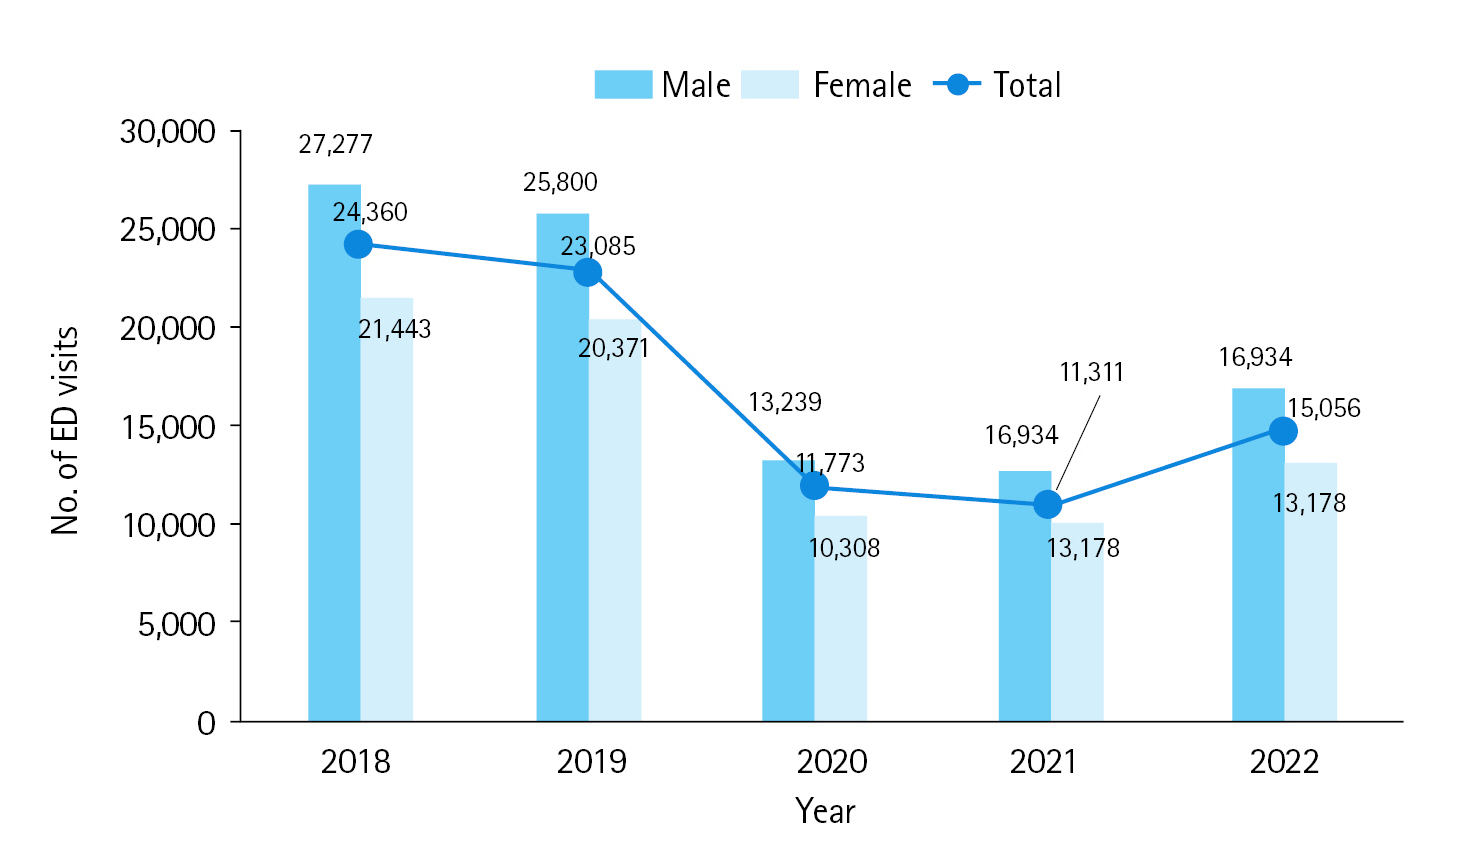
Age- and sex-standardized incidence rate per 100,000 pediatric patients. ED, emergency department.
Chief complaints and final diagnoses of pediatric patients
The most frequent chief complaints of children visiting the ED were fever (23.6%), followed by abdominal pain (9.6%), vomiting (4.7%), headache (2.6%), exanthema (2.4%), cough (2.2%), and urticaria (1.7%). The most prevalent final diagnoses were gastroenteritis and colitis of unspecified origin (8.0%), fever (4.2%), unspecified abdominal pain (2.5%), hyperpyrexia not otherwise specified (2.3%), and open wounds to other parts of the head (2.3%) (Table 4).
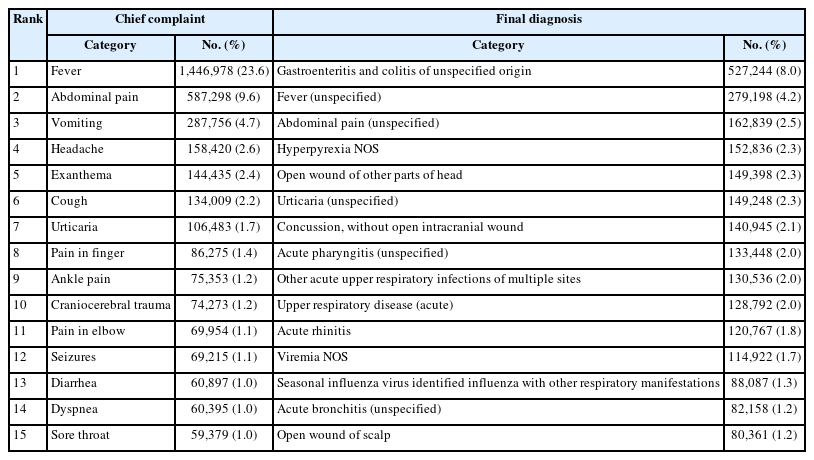
Chief complaints and final diagnosis of children (n=6,640,995)
Analysis of critically ill pediatric patients
From Fig. 2, the age- and sex-standardized in-hospital mortality rate (%) among pediatric patients was 0.05% in both 2018 and 2019 but increased to 0.09% in 2020. Similarly, both boys and girls saw an uptick in rates from 0.05% to 0.09% and from 0.05% to 0.08%, respectively.
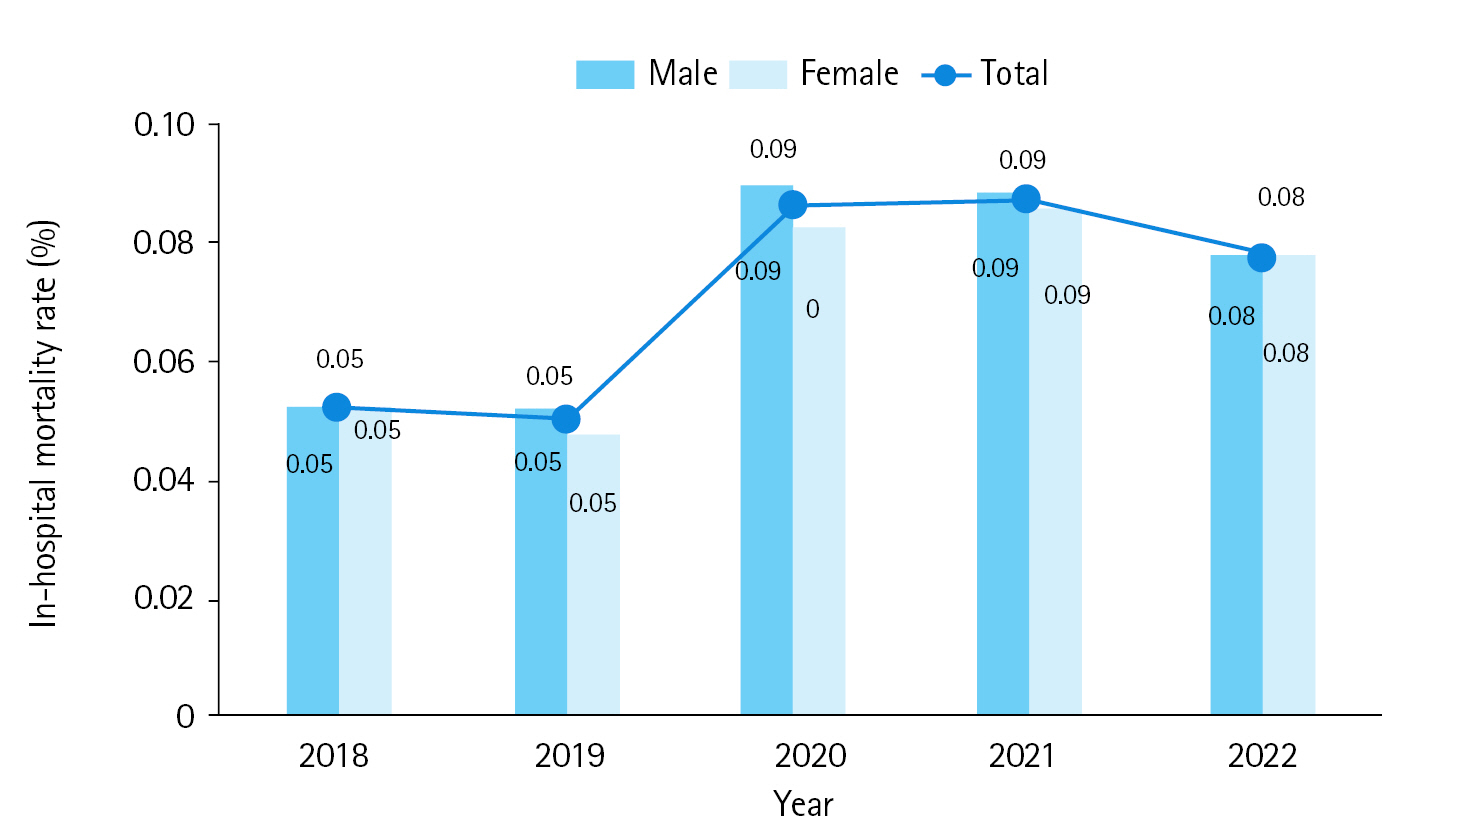
Age- and sex-standardized in-hospital mortality rate (%).
According to Fig. 3, the overall admission rate for patients remained relatively stable from 2019 to 2020, transitioning from 9.4% to 9.3%. The admission rate for boys remained consistent at 9.5% in both years, while, for girls, the rate slightly decreased from 9.2% to 9.0% (Fig. 3A). The overall transfer rate for patients increased marginally over time, from 0.48% in 2019 to 0.51% in 2020. For boys, the rate increased from 0.51% to 0.54%, while, for girls, it transitioned from 0.45% to 0.48% (Fig. 3B). Both admission and transfer rates remained relatively stable for the entire period from 2018–2022, regardless of sex.
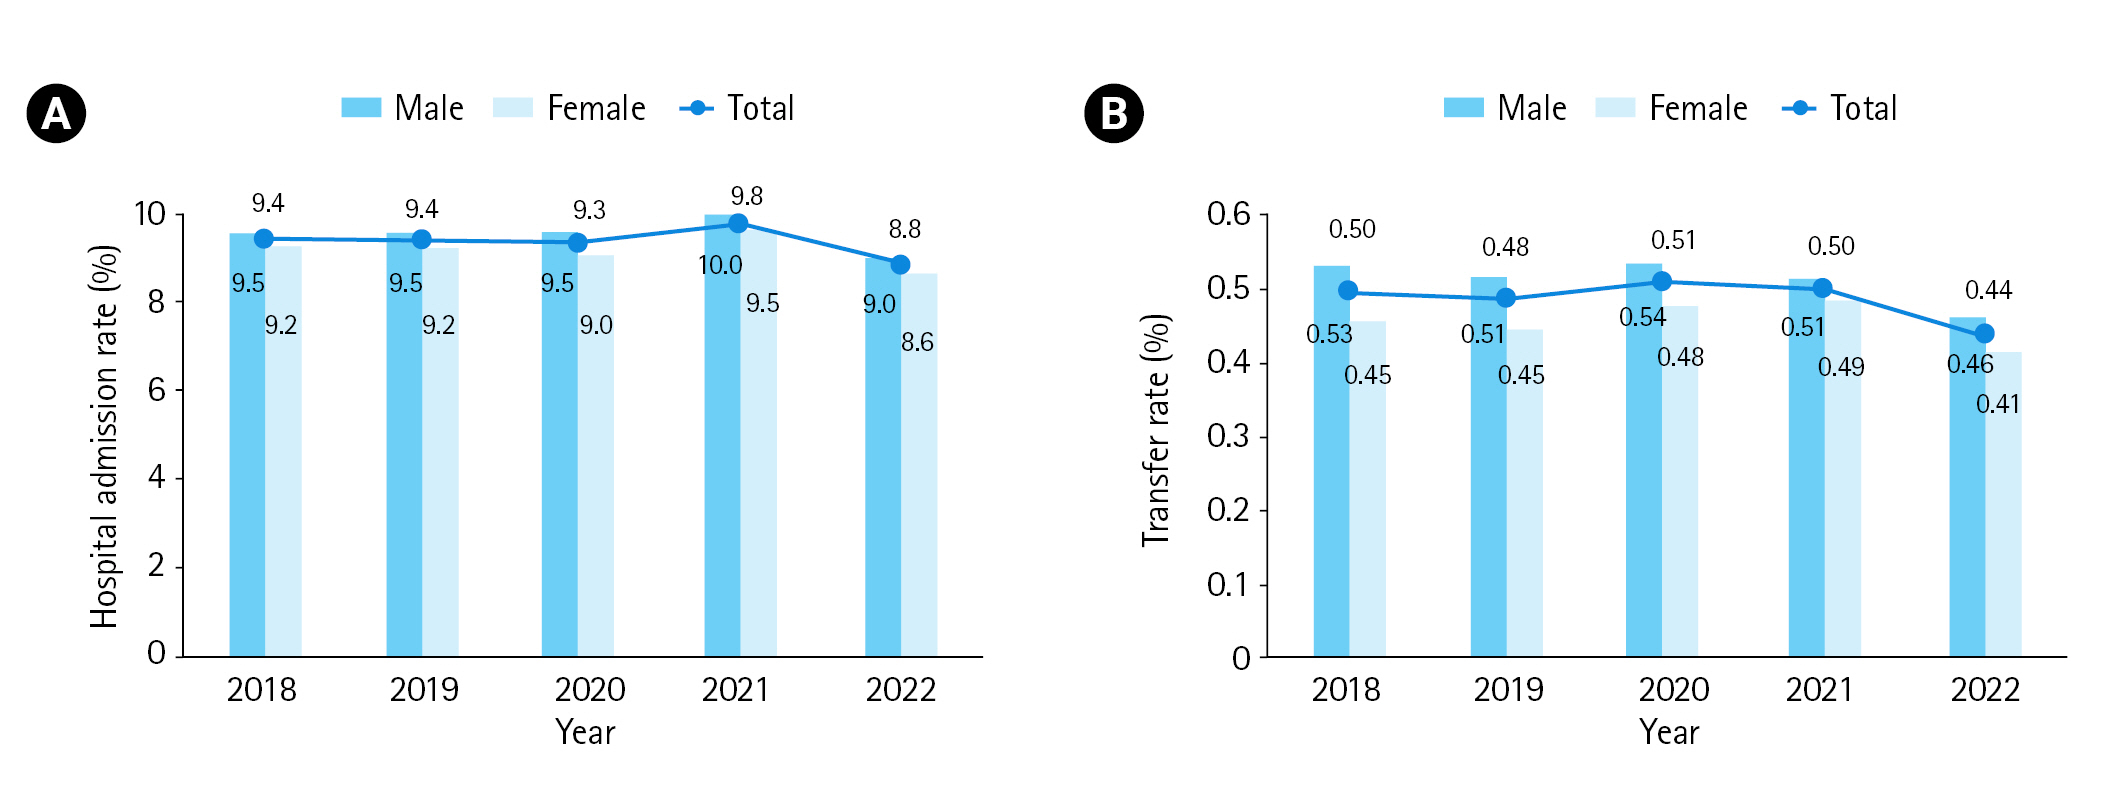
Final disposition. (A) Hospital admission rate. (B) Transfer rate.
DISCUSSION
This study provides a nationwide analysis of pediatric ED use in Korea over a span of 5 years, from 2018–2022. Most ED visits were made by boys, with those aged 1–6 years being the most frequent visitors, a trend consistent with previous studies [5,8,11,13–17]. During the preschool years, children in communal settings like daycare centers or kindergartens are easily exposed to respiratory and gastroenteritis viruses, facilitating the transmission of communicable diseases [18–20]. This predisposes them to conditions like otitis media and upper respiratory tract infections [21–22]. Consequently, ED visits are predominantly made by children in this age group.
A notable finding was that most ED visits occurred not during typical daytime hours on weekdays but from 16:00–24:00. This trend likely results from an increase in dual-income families, making it challenging to seek regular pediatric care during conventional hours. Parents tend to visit the ED after work hours, reflecting the high proportion of nonemergency visits during these times. In pediatrics, diseases rather than injuries constitute a major reason for ED visits. This is consistent with previous studies [5,8,11,13–15,17]. As depicted in Table 4, children primarily present to the ED with common symptoms like fever and abdominal pain rather than trauma. The KTAS data showed that 60.2% of children visiting the ED were in scores 4–5, and most of them were discharged, indicating that most pediatric ED visits were for mild conditions.
When comparing data based on KTAS score, it was observed that patients with higher acuity levels utilized the 119-ambulance service more frequently. This suggests that 119 ambulances predominantly transport patients with severe conditions. However, some patients with lower acuity levels were also transported by 119 ambulances, raising concerns about the appropriateness of these transfers and indicating a need for further investigation. In terms of hospital disposition by KTAS score, >90% of patients in most categories were discharged, suggesting that appropriate treatment was realized for pediatric patients.
When analyzing data by age, we found that infants <1 year of age used level I EDs more frequently than EDs of other levels, with a higher rate of severe emergency conditions. It is inferred that younger infants more often present with severe diseases and hence are often seen in high-level emergency centers, leading to higher hospital admission rates for this age group.
The ED visitation rate of pediatric patients in Korea was halved following the declaration of the COVID-19 pandemic in early 2020, a trend paralleling global observations. Well-documented factors contributing to this drastic decrease include the enactment of social distancing measures and school closures [5–10]. After the initial outbreak of SARS-CoV-2 in Wuhan, China, in December 2019 [23], its rapid global spread led the WHO to declare a global pandemic on March 11, 2020. Countries worldwide implemented various measures, including social distancing, hand hygiene, and vaccinations, to combat COVID-19. In Korea, the first case was reported on January 20, 2020 [24], and the government subsequently introduced guidelines, including mandatory mask-wearing and facility closures [25]. All schools and kindergartens were closed in March 2020, and distance learning was introduced the following month. This pandemic profoundly impacted global health and daily life. In our study, we observed a decrease of approximately 49% in pediatric ED visits from 2019 to 2020. This reduction likely stems from both national public health responses and caregivers' avoidance of potential COVID-19 case exposure in EDs.
While admission and transfer rates for children remained consistent before and after the start of the pandemic, the severity of cases increased. Some adult-focused studies reported an increase in mortality among hospitalized adult patients during the COVID-19 pandemic [26,27], a trend consistent with the increase in mortality observed among pediatric ED visitors in our study. Further research is needed to determine whether this increase in mortality resulted directly from COVID-19 or from resource limitations such as isolation room unavailability and healthcare worker shortages.
Pediatric ED visits were halved after the pandemic declaration, then slowly increased but remained below prepandemic levels. Social distancing, introduced in 2020 and maintained for 3 years, combined with public health education on hand hygiene and mask-wearing, likely contributed to this trend. Social distancing has been known to reduce respiratory and various infections in pediatric patients [9,28], and there are reports correlating distancing and school closures with decreased pediatric admissions for respiratory and gastrointestinal diseases [29].
This study presents a limitation. While we analyzed levels I to III medical facilities, detailed analysis of the available medical personnel, equipment conditions, and the presence of pediatric wards or pediatric intensive care units in each level of emergency medical institution was not available in the dataset. Therefore, it is undetermined how many severe patients each emergency medical facility could admit and treat.
Through this study, we could observe the patterns of pediatric ED utilization in Korea over 5 years. Although the admission and transfer rates remained similar, the observed increase in mortality rates may be linked to various societal issues, such as a shortage of COVID-19 isolation rooms and the scarcity of pediatric specialists. Moreover, while most pediatric patients were mild cases with a KTAS score of ≥3, severe patients more predominantly presented with medical problems rather than trauma. Measures must be taken to accommodate these severe patients by providing adequate funding for pediatric physicians, enhancing neonatal and pediatric intensive care units, raising medical fees, and establishing networks among emergency medical institutions to avoid gaps in medical care. Additionally, guidelines should be established for each emergency medical institution, enabling efficient dispositions, such as a policy to transfer mild cases like minor pediatric traumas to general medical facilities. This would help prevent patient buildup in higher-level medical facilities and mitigate burnout among medical staff.
Through this analysis, we identified the characteristics of pediatric patients visiting EDs. Notably, we observed a sharp decline in pediatric ED visits after the start of the COVID-19 pandemic. Thereafter, ED visits slowly increased but remained below prepandemic levels for 3 years. This research will serve as a foundational resource for appropriately allocating and preparing pediatric ED resources.
Notes
Author contributions
Conceptualization: all authors; Data curation: YSR, JK; Methodology: all authors; Project administration: YSR; Visualization: JHH, JK, JHK; Writing–original draft: JHH; Writing–review & editing: all authors.
All authors read and approved the final manuscript.
Conflicts of interest
The authors have no conflicts of interest to declare.
Funding
The authors received no financial support for this study.
Data availability
Data of this study are from the National Emergency Medical Center (NEMC; Seoul, Korea) under the Ministry of Health and Welfare of Korea, which were used under license for the current study. Although the data are not publicly accessible, they are available from the corresponding author upon reasonable request with permission from the NEMC.
SUPPLEMENTARY MATERIAL
Supplementary materials are available from https://doi.org/10.15441/ceem.23.150.
Supplementary Table 1.
. Severe illness diagnosis codes
References
Article information Continued
Notes
Capsule Summary
What is already known
In Korea, emergency department (ED) visits decreased noticeably among pediatric patients after the start of the COVID-19 pandemic.
What is new in the current study
Through this national data analysis, we identified the characteristics of pediatric patients visiting EDs and observed a sharp decline in their ED visits after the start of the COVID-19 pandemic. Also, for 3 years thereafter, ED visits slowly increased but remained below prepandemic levels. This research will serve as a foundational resource for appropriately allocating and preparing pediatric ED resources.