Recent status of sudden cardiac arrests in emergency medical facilities: a report from the National Emergency Department Information System (NEDIS) of Korea, 2018–2022
Article information

INTRODUCTION
The number of sudden cardiac arrest cases in Korea increased by approximately 1.6 times over an 11-year period, from 19,480 cases in 2006 to 30,782 cases in 2019 [1]. While several studies have been conducted on the prognosis of cardiac arrest patients during the 2019 COVID-19 pandemic [2–6], there have been no reports on mortality rates based on acute cardiac arrest presenting to the emergency department (ED). The purpose of this commentary is to introduce the current status of sudden cardiac arrest presenting to the ED (out-of-hospital cardiac arrest [OHCA] and in-hospital cardiac arrest [IHCA]) from 2018 to 2022, and to discuss the appropriate direction for future allocation of ED medical resources through comparison with data of emergency medical services system (EMSS) in Korea [6].
Ethics statement
The study was approved by the Institutional Review Board of the National Medical Center (No. NMC-2023-08-094). The requirement for informed consent was waived due to the retrospective nature of the study.
DATA ACQUISITION
Patients with sudden cardiac arrest comprised those with cardiac arrest who presented to the ED and were diagnosed with cardiac arrest (International Classification of Diseases, 10th Revision [ICD-10]: I46, I460, I469, R092) or who received cardiopulmonary resuscitation (CPR) in the ED (OHCA and IHCA) according to the National Emergency Department Information System (NEDIS). NEDIS is an emergency information network designed by the Ministry of Health and Welfare of Korea and operated by the National Emergency Medical Center (Seoul, Korea); it has been in use since 2003. NEDIS includes administrative and clinical information on all patients who have visited one of the 410 nationwide EDs across Korea [7,8]. The NEDIS database contain patient information, including demographics (sex, age, address, and insurance), symptoms (chief complaints and onset), prehospital conditions (EMS use and treatment), and ED conditions (vital signs and level of consciousness at presentation, triage, diagnosis codes based on the ICD-10, disposition, hospital stay after admission, and final clinical outcomes). All patient-related information was automatically transferred from each hospital to a central server according to established protocols. Inaccurate data were filtered by a data processing system [3]. The numbers of emergency medical facilities of level I (regional emergency medical center), level II (local emergency medical center), and level III (local emergency medical institution) changed from 36, 118, and 248 in 2018 to 40, 126, and 244 in 2022, respectively. We extracted patients who presented to the ED within 24 hours of the onset of their chief complaint and who met one or all of the following criteria: (1) cardiac arrest diagnosis in the discharge code; or (2) a CPR code in the ED treatment. Cases of "dead on arrival (DOA) not eligible for treatment" or "non-clinical visits" in the ED treatment outcome field were excluded.
CURRENT STATUS OF CARDIAC ARREST PATIENTS
Table 1 shows characteristics of cardiac arrest patients presenting to an ED (both OHCA and IHCA) between 2018 and 2022, comprising 149,063 patients with sudden cardiac arrest. The age- and sex-standardized ED visits per 100,000 population showed a slight decrease from 57.5 in 2018 to 56.5 in 2020, followed by an increase to 58.9 in 2022 (Fig. 1). Throughout this period, the incidence rate for men ranged from 81.2% to 84.4%, which was more than 2.2 times higher than the rate for women, ranging from 35.5% to 37.6% (Fig. 1). By age, individuals aged 65 years or older (with an average age of 78.4 years) represented 58.9% of cases, significantly higher than the 1.9% for those aged 17 years or younger (with an average age of 1.9 years).
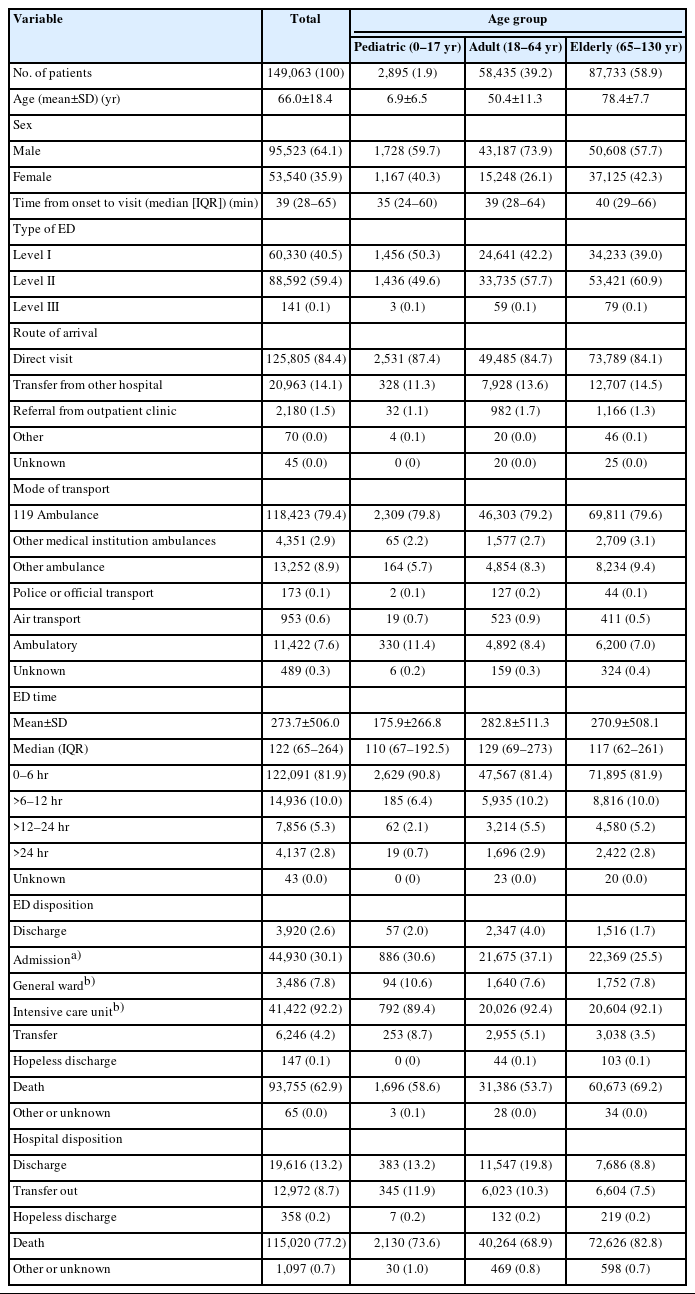
Cardiac arrest patient demographics, ED visit characteristics, and outcome according to age

Age- and sex-standardized incidence rate per 100,000 population.
Table 2 shows the distribution of sudden cardiac arrest cases according to level of ED as follows: level I (40.5%), level II (59.4%), and level III (0.1%) centers. The most common means of transportation for ED visits was 119 ambulance (79.4%). In level I centers, the proportion of transport using a 119 ambulance was lower than that of level II or III centers. Instead, there was a higher proportion of air transport (1.4%), other medical institution ambulances (5.0%), and other ambulances (12.5%). The median time from cardiac arrest to arrival at an ED facility was 39 minutes (interquartile range [IQR], 28–61 minutes). This duration varied by facility type: level I (45 minutes; IQR, 30–93 minutes), level II (37 minutes; IQR, 27–60 minutes), and level III (31 minutes; IQR, 23–46 minutes). A total of 44,930 patients (30.1%) was hospitalized; of which 41,422 (92.2%) were admitted to intensive care units and 3,486 (7.8%) to general wards after ED treatment, and 22 individuals were classified as "other" and admitted. These admissions were distributed across level I (34.9%), level II (26.9%), and level III (22.0%) EDs. Patients who were transferred after ED treatment were as follows: level I, 1,391 patients (2.3%); level II, 4,828 patients (5.4%); and level III, 27 patients (19.1%).
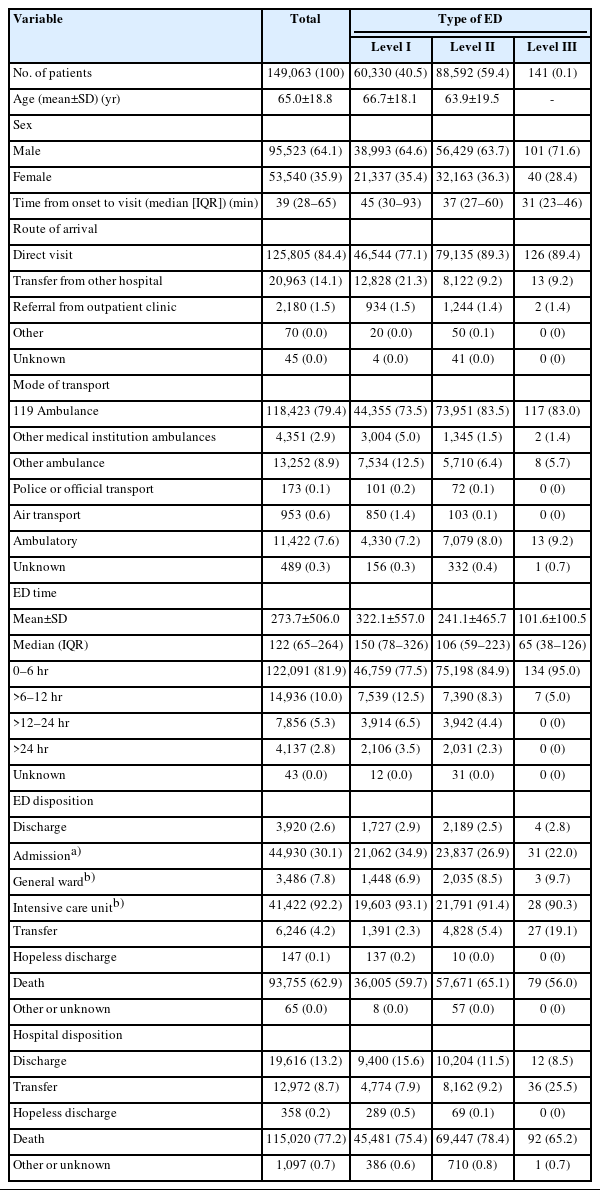
Patient demographics, ED visit characteristics and outcome according to level of the centers
Among patients with sudden cardiac arrest that occurred at EDs in Korea during the study period, a total of 115,020 (77.2%) died in hospital (Table 2). In-hospital mortality increased from 75.2% in 2018 to 79.4% in 2021, followed by a decrease to 78.1% in 2022 (Fig. 2A). The mortality rate for female patients ranged from 78.5% to 83.0%, while that for male patients ranged from 73.3% to 77.3% (Fig. 1B). The mortality rate for women was consistently higher than that for men across the study period (Fig. 2A). Additionally, the standardized mortality rate increased from 245.5 per 100,000 population who visited the ED in 2018 to 329.0 in 2021, before decreasing again to 308.3 in 2022. Throughout this period, the age- and sex-standardized mortality rate per 100,000 ED visits for men ranged from 315.6 to 423.7, which was approximately 2.0 times higher than that for women, ranging from 175.7 to 234.4 (Fig. 2B)
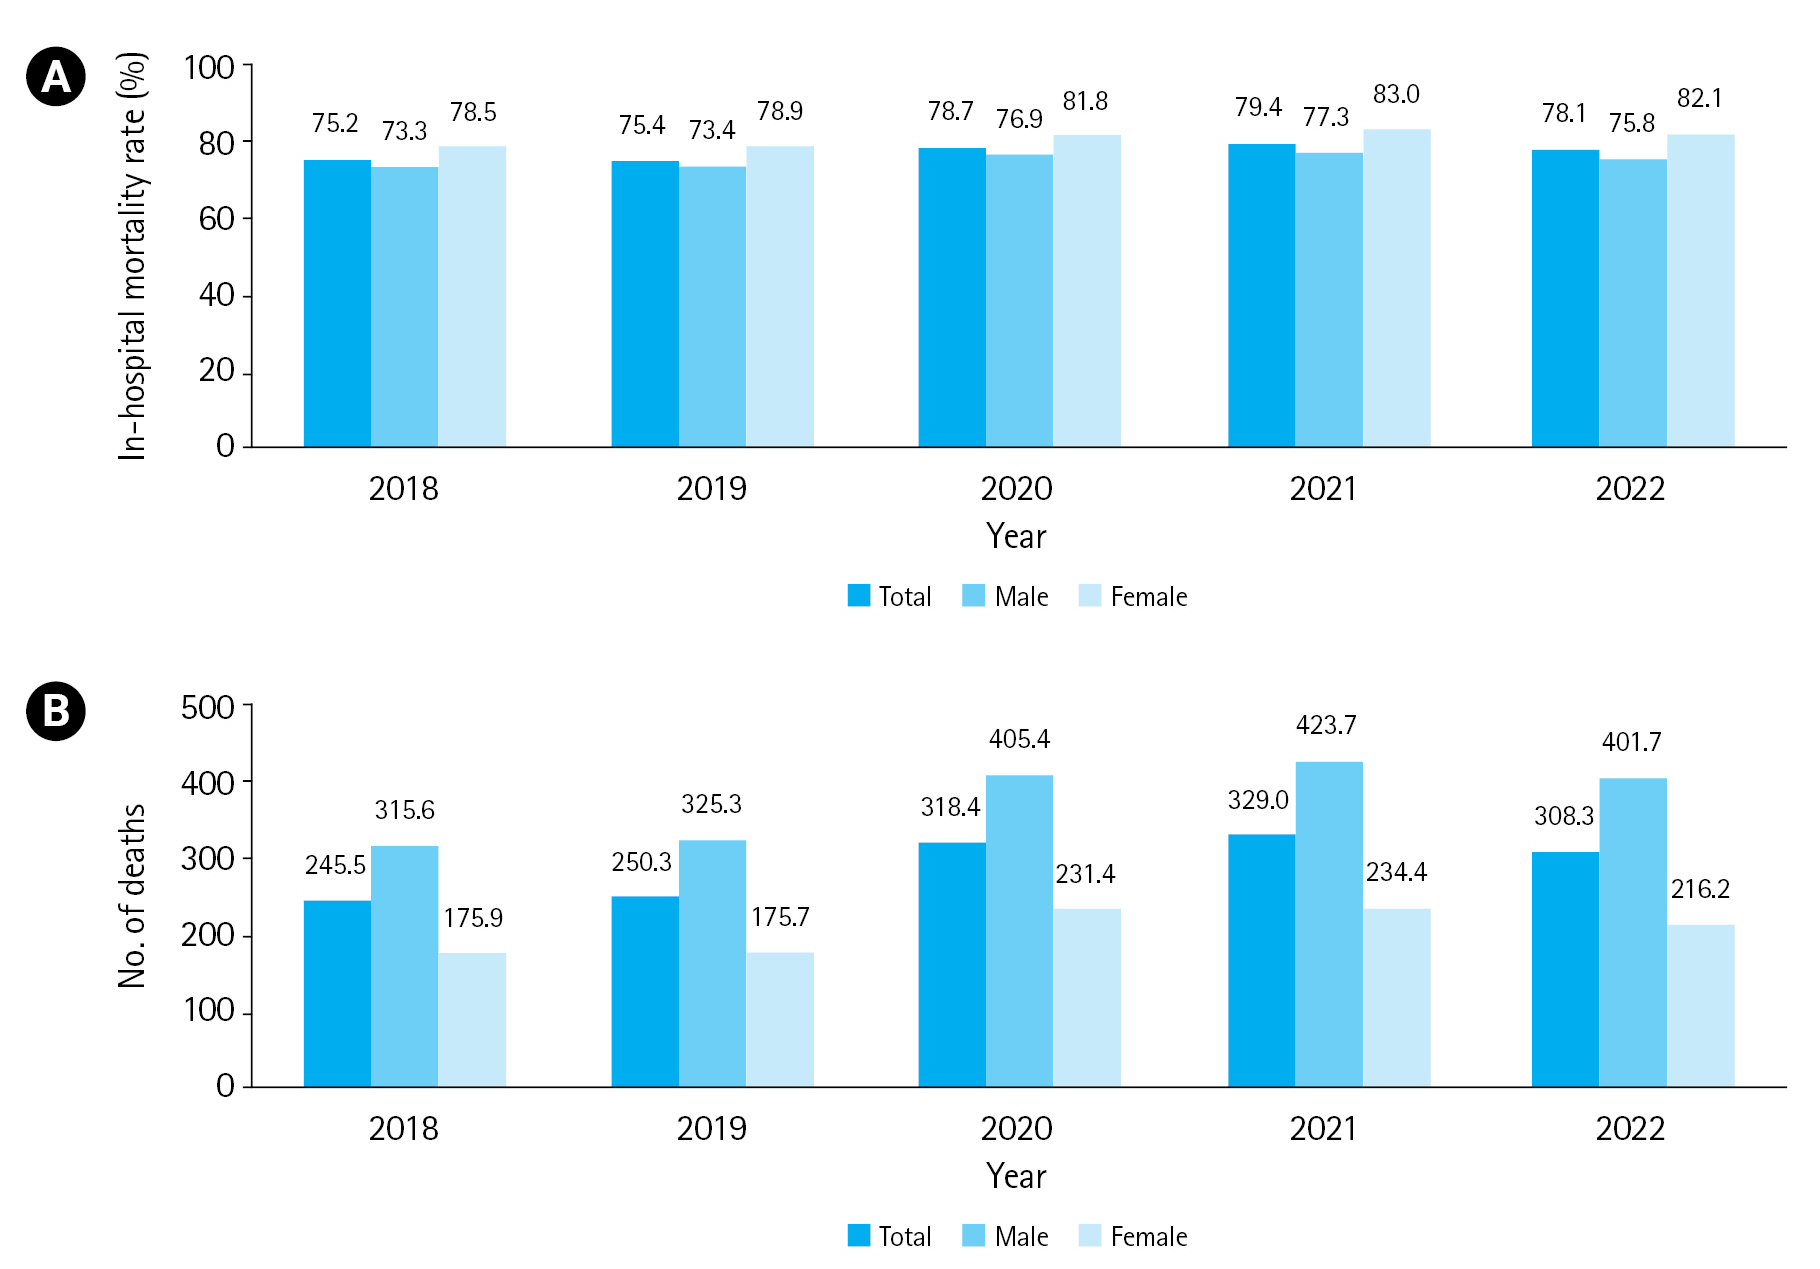
Age- and sex-standardized mortality rate. (A) In-hospital mortality. (B) Mortality per 100,000 emergency department visits.
DISCUSSION
The data of cardiac arrest patients used in this study differ from the information typically gathered for the national OHCA registry database from the Korea Disease Control and Prevention Agency (KDCA), which are usually collected by the EMSS for ambulance transport. Instead, this dataset consisted of patients who received CPR at level I, II, or III domestic EDs. The significance if the study lies in its emphasis on evaluating ED resources rather than providing an overall assessment of the national EMSS.
When reviewing the data of sudden cardiac arrest patients transported by the EMSS, there was an observable trend of an increase of occurrence from 59.5 per 100,000 population in 2018 to 64.7 in 2021. However, the rate decreased from 57.5 in 2018 to 56.5 in 2020, before again increasing to 58.2 in 2021 [9]. Approximately 20.6% of patients visited the ED by means of transportation other than the 119 ambulance examples, but the number of cardiac arrest patients reported was lower than the number of patients transported by EMSS. The observed differences are likely attributed to the exclusion of DOA patients in this study and to missing inclusion of the time of onset of chief complaints in level III EDs in the NEDIS data transmission. Thus, given that this study excluded patients who presented to the ED more than 24 hours after the onset of their chief complaint, it is highly likely that patients with cardiac arrest who visited level III EDs (both OHCA and IHCA) were excluded. Therefore, despite combining data for OHCA and IHCA patients who visited the ED, the incidence rate may be lower than the OHCA data of the CDC.
However, both in-hospital mortality rate and age- and sex-standardized mortality rate per 100,000 ED visits, with the exception of 2022, increased from 2018 to 2021. Two potential explanations can be considered for this trend. First, the trend could be related to a comparative study of in-hospital mortality before and after 2020, a year when COVID-19 produced a higher in-hospital mortality rate among patients seeking ED care [3]. Additionally, there have been reports of a decrease in return of spontaneous circulation rate prior to hospital arrival during this period [4]. Through this, we can estimate that the in-hospital mortality rate of cardiac arrest patients due to COVID-19 peaked in 2021 and subsequently decreased. However, a limitation of this study is the inability to analyze long-term neurological outcomes related to the mortality rates of CPR performed in domestic ED during the study period. Additionally, the lack of data for the year 2023 prevented us from determining whether the in-hospital mortality rate continued to decrease after 2022.
CONCLUSION
The in-hospital mortality rate of sudden cardiac arrest patients who presented to the ED exhibited an increasing trend from 2018 to 2021, but decreased from 2022 onward. Furthermore, to better allocate and efficiently utilize in-hospital emergency medical resources, it is important to analyze not only OHCA patients transferred via the EMSS, but also data from sudden cardiac arrest patients who presented to the ED (both OHCA and IHCA).
Notes
Author contributions
Conceptualization: all authors; Data curation: SK, YSR; Methodology: all authors; Project administration: YSR; Visualization: JSP, SK; Writing–original draft: JSP, BKL; Writing–review & editing: all authors. All authors read and approved the final manuscript.
Conflicts of interest
The authors have no conflicts of interest to declare.
Funding
The authors received no financial support for this study.
Data availability
Data of this study are from the National Emergency Medical Center (NEMC; Seoul, Korea) under the Ministry of Health and Welfare of Korea, which were used under license for the current study. Although the data are not publicly accessible, they are available from the corresponding author upon reasonable request with permission from the NEMC.