Diagnostic accuracy and implementation of computed tomography angiography for gastrointestinal hemorrhage according to clinical severity
Article information
Abstract
Objective
This study compared the diagnostic accuracy of computed tomography (CT) angiography in patients with various severities of gastrointestinal hemorrhage (GIH).
Methods
We retrospectively enrolled adult patients (n=262) with GIH who had undergone CT angiography from January 2012 to December 2013. Age, sex, comorbidities, presenting symptoms, initial vital signs, laboratory results, transfusion volume, emergency department disposition, and hospital mortality were abstracted from patient records. CT angiography findings were reviewed and compared to reference standards consisting of endoscopy, conventional angiography, bleeding scan, capsule endoscopy, and surgery, either alone or in combination. Clinical severity was stratified according to the number of packed red blood cell units transfused during the first two days: the first quartile was categorized as mild severity, while the second and third quartiles were categorized as moderate severity. The fourth quartile was categorized as severe.
Results
Patients were categorized into the mild (n=75, 28.6%), moderate (n=139, 53.1%), and severe (n=48, 18.3%) groups. The mean number of transfused packed red blood cell units was 0, 3, and 9.6 in the mild, moderate, and severe groups, respectively. The overall sensitivity, specificity, positive predictive value, and negative predictive value of CT angiography were 73.8%, 94.0%, 97.3%, and 55.3%, respectively. The area under the receiver operating characteristics curve for the diagnostic performance of CT angiography was 0.780, 0.841, and 0.930 in the mild, moderate, and severe groups, respectively, which significantly differed among groups (P=0.006).
Conclusion
The diagnostic accuracy of CT angiography is better in patients with more severe GIH.
INTRODUCTION
Acute gastrointestinal hemorrhage (GIH) is one of the most common emergencies encountered in emergency departments (EDs), with annual incidences of 40–150/100,000 and 20–27/100,000 people for upper and lower GIH, respectively [1]. Despite advances in diagnostic and treatment modalities, GIH still has a significant risk of mortality, ranging from 8% to 16% [2].
Endoscopy is considered the primary diagnostic tool for GIH, offering high sensitivity and specificity [3]. Endoscopy also has an advantage for treatment of GIH by direct hemostasis. However, endoscopy is not always a suitable option because it requires bowel preparation and an endoscopist. Furthermore, it is technically difficult to perform endoscopy in cases of severe active bleeding, which affects visibility during endoscopy [3].
Recent advances in imaging technologies have made multidetector row computed tomography more generally accessible. CT angiography (CTA) is a useful tool for evaluation and localization of GIH [4]. CTA is readily available in many EDs and can guide subsequent therapeutic treatments, such as surgery, endoscopy, or angiographic embolization [1,2,4-6].
A previous analysis of 22 studies and 672 patients concluded that CTA has high overall sensitivity (85.2%) and specificity (92.1%) for diagnosis of GIH [2]. Although CTA has an acceptable diagnostic accuracy in GIH, it also carries a risk of radiation hazard and contrast-induced nephropathy [7,8]. Therefore, the balance between the benefit of urgent diagnosis and the risk of adverse events should be determined before performing CTA in GIH.
The most specific finding of GIH in CTA is active extravasation of contrast dye. Thus, it is reasonable to assume that active extravasation would be more frequently observed in patients with more severe GIH. However, to our knowledge, no study has yet evaluated whether the diagnostic accuracy of CTA differs in patients with various severities of GIH. We hypothesized that CTA would have better diagnostic accuracy in patients with massive, ongoing, significant hemorrhage than in those with clinically stable, insignificant hemorrhage.
Therefore, our study evaluated the diagnostic accuracy of CTA in GIH according to clinical severity.
METHODS
Setting and population
This retrospective study was performed in a single urban tertiary-care academic ED with an annual census of about 70,000. All adult patients who visited the ED and underwent the GIH-protocol CTA from January 2012 to December 2013 were screened. Among them, patients who did not present with symptoms of hematemesis, melena, and hematochezia were excluded. In addition, we excluded patients with trauma and patients without further diagnostic evaluations in addition to GIH CTA to confirm the diagnosis. These diagnostic evaluations included esophago-gastro-duodenoscopy (EGD), colonoscopy, sigmoidoscopy, capsule endoscopy, bleeding scan, conventional angiography, and surgery, either alone or in combination. These diagnostic or therapeutic techniques were performed during ED stays or subsequent hospital admissions. All diagnostic evaluations and transfusion decisions were at the discretion of the treating physicians. All patients received CTA with the same protocol, including three-phase scans of noncontrast, arterial, and portal phase and infusion of 75–90 mL non-ionic low-osmolar contrast material. Three-millimeter thickness images were obtained using either Aquilion One TSX-301A (320- detector; Toshiba, Tokyo, Japan) or Brilliance (64-detector; Philips, Best, Netherlands) CT scanners.
Measures
All data were extracted from the electronic medical record database and reviewed by two independent researchers. The extracted variables included age; sex; presenting symptoms; comorbidities (liver disease, malignancy); initial vital signs; initial laboratory findings (hemoglobin, platelet counts, blood urea nitrogen, creatinine, albumin, and international normalized ratio of prothrombin time); types of diagnostic evaluations; number of packed red blood cell (PRBC) units transfused during the first two days; whether the therapeutic interventions included endoscopy, surgery, or interventional radiology; disposition at ED discharge (ward, intensive care unit [ICU], transfer, and discharged home); and hospital mortality.
Clinical severity was defined according to the number of units of PRBC transfused during the first two days. Transfusions were categorized into four quartiles and patients were stratified into mild (first quartile), moderate (second and third quartiles), and severe (fourth quartile) groups. Radiologists not blinded to the clinical findings, including endoscopy results, interpreted the CTA results. Positive CTA findings were defined as any sign of contrast media extravasation in the arterial phase and its dispersion in the venous phase. Enhancement of the bowel wall and presence of vascular abnormalities such as polyps or tumors were also considered positive findings [1,4,6]. The results of other diagnostic techniques were considered positive if they indicated active or suspicious bleeding foci. If the available diagnostic tests could not identify any bleeding foci, then the reference test result was considered negative.
Analysis
Continuous variables are expressed as means with 95% confidence intervals (CIs), and categorical data are presented as the percent frequency of occurrence. Chi-square and one-way ANOVA tests were used to compare differences among the three severity groups. A two-tailed P<0.05 indicated statistical significance. For significant differences among groups in the one-way ANOVA test, Bonferroni correction was used for post-hoc analysis, and P<0.017 was considered statistically significant. The diagnostic accuracy of CTA was analyzed by calculating the sensitivity, specificity, positive predictive value (PPV), negative predictive value (NPV), and area under the receiver operating characteristics curve (AUC) with 95% CIs. AUCs were compared using algorithms as described previously [9]. This study was approved by the institutional review board (no. 1404-036-570) and was exempted from patient informed consent.
RESULTS
Among 401 patients who underwent GIH-CTA during the study period, 50 patients without symptoms of GIH, 14 with trauma, and 75 without further diagnostic evaluations were excluded. Finally, 262 patients were analyzed. Those patients were categorized into the mild (n=75, 28.6%), moderate (n=139, 53.1%), and severe (n=48, 18.3%) groups according to the number of units transfused in the first two days (Fig. 1).
Patient enrollment process. CT, computed tomography.
The mean age did not differ among severity groups (Table 1). The proportion of male patients was higher in the severe group. Hematemesis was more frequently observed as a presenting symptom in patients in the severe group. Initial blood pressure was lower in patients who received larger transfusion volumes, and initial heart rates were higher in the severe group than in the mild group. Patients in the severe group had lower serum hemoglobin concentrations, lower platelet counts, higher blood urea nitrogen, and lower albumin levels. More than 70% of analyzed patients underwent EGD for additional diagnostic evaluation. Lower gastrointestinal endoscopy was more frequently performed in patients in the mild group. However, conventional angiography was performed more frequently in the severe group. Therapeutic interventions were more frequently performed in the severe group.
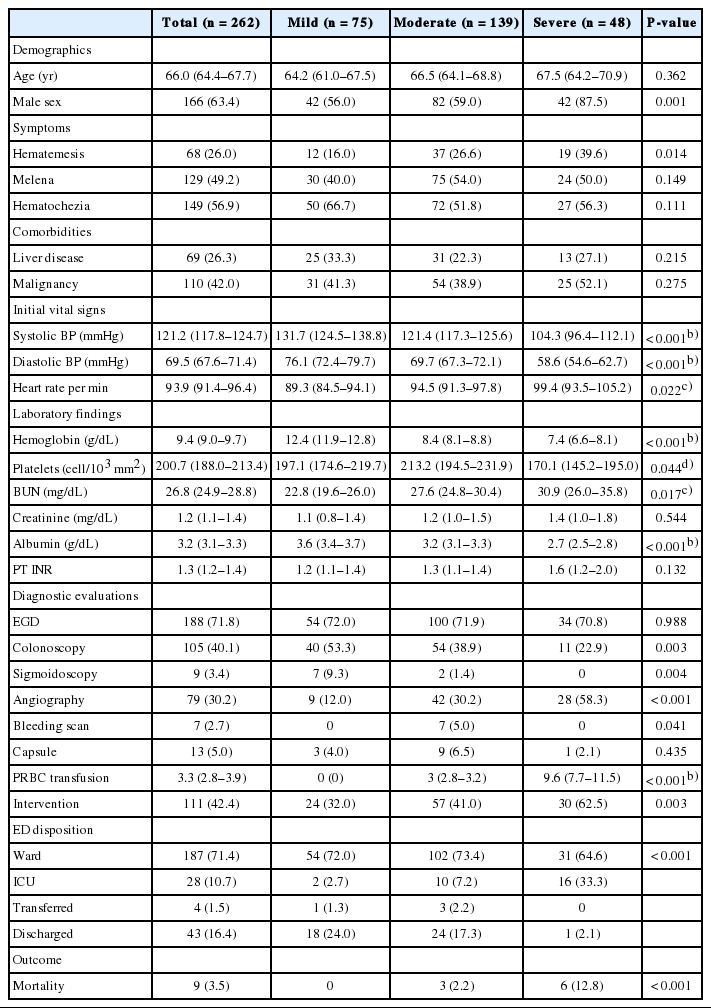
The mild, moderate, and severe groups received a mean of 0, 3, and 9.6 units of transfused PRBC, respectively. One-third of the patients in the severe group (n=16, 33.3%) were admitted to the ICU, and 6 (12.8%) died during admission. However, only two (2.7%) patients in the mild group were admitted to the ICU, and none died.
The diagnostic accuracy of CTA in GIH patients is summarized in Table 2. The rate of bleeding foci identification in the reference evaluations was 74.4%. The overall sensitivity, specificity, PPV, and NPV of CT angiography was 73.8%, 94.0%, 97.3%, and 55.3%, respectively. The AUC of CTA to diagnose the GIH was 0.839 (95% CI, 0.797 to 0.881). As the severity increased, the rate of reference positivity and CTA sensitivity also increased. However, the specificity remained high in all groups. As a result, the AUC of CTA varied significantly among groups (P=0.006) (Fig. 2).
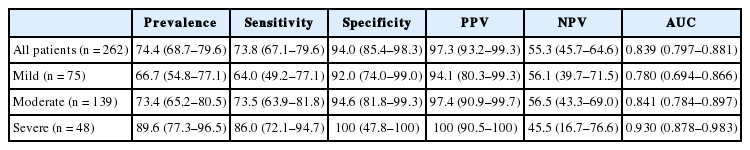
Diagnostic accuracy of computed tomography angiography in patients with various severities of gastrointestinal hemorrhage
Receiver operating characteristics curves for the diagnostic performance of computed tomography angiography in cases of gastrointestinal hemorrhage. The area under the receiver operating characteristics curve (AUC) was larger in patients who received more packed red blood cells (P=0.006).
DISCUSSION
The goal of this study was to evaluate the diagnostic accuracy of CTA in GIH among patients with severe hemorrhage. The AUC of CTA was significantly higher in patients who received a larger volume of PRBC during the first two days. To our knowledge, this is the first study to show that the diagnostic accuracy of CTA differs according to the clinical severity of GIH.
The clinical severity of GIH in this study was stratified by the transfusion amount during the first two days. However, one may argue that the transfusion amount cannot be determined before the decision to order a CTA in ED. There are several reasons why we used transfusion amounts to determine GIH severity. First, the number of transfused units was the best available measure to objectively categorize patients. Although there are some clinical risk stratification methods such as Glasgow-Blatchford and AIMS65 scores, those methods are only applicable to patients with upper GIH [10,11]. Second, the purpose of this study was not to identify the patients who would most benefit from CTA, but rather to evaluate the diagnostic accuracy of CTA in cases of different clinical severity. For that purpose, transfused units were used to estimate GIH severity. As a result, hemodynamic instability and laboratory abnormalities were more frequently observed in the severe group. Although patients in the mild group did not receive transfusions, the severe group received at least 6 units of PRBC during the first 2 days. Hemostatic interventions were more frequently performed in the severe group. Furthermore, ICU admission and mortality rates were also higher in the severe group. These findings suggest the appropriateness of the severity categorization used in this study.
The proportion of men was higher in the severe group. A previous study of 2,133 patients with upper GIH also reported a higher upper GIH incidence rate in men [12]. Because hematemesis was a more frequent presenting symptom in the severe group, and the hemorrhage severity is worse in upper GIH than in lower GIH, the severe group was mainly composed of upper GIH. However, the rate of EGD did not differ among groups. Instead, colonoscopy and sigmoidoscopy were less frequently performed in the severe group. The possible reasons for this observation include unstable patient condition that prevented GI preparation or identification and management of bleeding foci using EGD or conventional angiography. More than half (28/48, 58.3%) of the patients in the severe group and 42 of 139 (30.2%) in the moderate group underwent conventional angiography. Interventional angiography is always available for control of both upper and lower GIH in our institution [13,14]. Therefore, the rate of conventional angiography was relatively high in this study. In addition, this setting might have decreased the threshold for performing CTA in the ED; as a result, the number of cases in this study was relatively large compared to the numbers analyzed in previous studies [1,2,4-6].
The overall discrimination power of CTA for diagnosing GIH was very good (AUC >0.8) and the specificity was higher than the sensitivity. Positive CTA findings such as active extravasation of contrast material are very specific findings of GIH. However, such findings cannot always be visualized if the bleeding is transient. Therefore, the sensitivity of CTA is not high. These findings are consistent with those reported in previous studies [2].
The prevalence of reference-positive patients was higher in the severe group, which results in increased PPV and decreased NPV [15], consistent with the findings in the current study. However, increased prevalence does not influence sensitivity and specificity [15]. The higher AUC in the severe group was mainly due to the increased sensitivity. The fact that ongoing hemorrhage is more frequent and persists longer in more severe cases of GIH likely explains the higher sensitivity observed in the severe group. As a result, the AUC was highest in the severe group.
Endoscopy remains the diagnostic tool of choice in GIH because it offers both diagnosis and treatment of upper and lower GIH. However, endoscopy is not always available and visibility is sometimes poor, especially in cases of massive hemorrhage. Meanwhile, CTA showed good diagnostic accuracy in previous studies as well as in this study [2,4-6,16]. CTA is increasingly performed in many EDs, especially in institutions where interventional angiography is available. CTA may provide information about the presence of active bleeding, the hemorrhage site, and vascular anatomy to help inform subsequent angiographic interventions. Thus, CTA could be another option for GIH.
This study has several limitations. First, the selection of patients might be biased because only patients who underwent a GIH-protocol CTA were enrolled. The results of this study do not fully represent the study population, because patients with symptoms of GIH who did not undergo CTA might have had different characteristics. Second, the reference results were obtained by available diagnostic evaluations, while there are no standard evaluation protocols for GIH. Although the rate of EGD did not differ between groups, the rates of colonoscopy or sigmoidoscopy and angiography did differ significantly among severity groups. Although diagnostic evaluations in GIH may vary according to hemorrhage site, hemodynamic instability, and the presence of ongoing hemorrhage, it would be better if a standard diagnostic protocol existed. However, these limitations could not be overcome in this retrospective study.
In conclusion, the diagnostic accuracy of CTA is better in patients with more severe GIH. As mentioned above, CTA has some disadvantages, including radiation exposure, nephrotoxicity, and anaphylaxis associated with contrast materials. Therefore, CTA is not justified over endoscopy in patients with mild GIH, which do not require transfusion. More studies are necessary to define the precise indications for performing CTA in GIH.
Notes
No potential conflict of interest relevant to this article was reported.
References
Article information Continued
Notes
Capsule Summary
What is already known
The diagnostic performance of computer tomography angiography in gastrointestinal hemorrhage is generally considered to be good.
What is new in the current study
To our knowledge, this is the first study to show the differences in the diagnostic performance of computer tomography angiography according to the clinical severity of gastrointestinal hemorrhage.