Abstract
-
Objective
The Trauma and Injury Severity Score (TRISS) has been used to predict trauma patient mortality and to assess the quality of trauma care systems. The goal of this investigation was to develop a modified trauma-related injury severity score (termed the TRISS-D) for predicting disability in acute trauma patients.
-
Methods
We used data collected by emergency medical services and entered into the Korea Centers for Disease Control and Prevention severe trauma database. The TRISS-D was based on age category (0–14, 15–54, ≥55 years), the Revised Trauma Score, and the Injury Severity Score. The outcome measures were severe disability and worsening disability. Worsening disability was defined as a lower Glasgow Outcome Scale score at hospital discharge than before the traumatic incident. Two types of cases were examined: those with penetrating or blunt injuries (group 1) and those with severe head injuries (group 2). We assessed the discriminatory power of the TRISS-D by calculating the area under a receiver operating characteristic curve (AUROC).
-
Results
The database comprised 14,791 patients; overall, 3,757 (25%) had severe disability and 6,018 (41%) had worsening disability. For severe disability, the AUROC (95% confidence interval) for the TRISS-D was 0.948 (0.944–0.952) in group 1 and 0.950 (0.946–0.954) in group 2. The corresponding values for worsening disability were 0.810 (0.803–0.817) and 0.816 (0.809–0.823), respectively.
-
Conclusion
The TRISS-D showed excellent discriminatory power for severe disability and very good discriminatory power for worsening disability.
-
Keywords: Trauma; Injury severity score; Disability evaluation
Capsule Summary
What is already known
The Trauma and Injury Severity Score (TRISS) was proposed to predict the probability of survival following traumatic injury. It is a weighted combination of the Revised Trauma Score, the Injury Severity Score, and patient age.
What is new in the current study
We developed a modified TRISS model predicting disability (TRISS-D) in acute trauma populations. We also sought to assess the discriminatory power of TRISS-D to predict severe disability or worsening disability after acute trauma.
INTRODUCTION
In the United States, trauma is the leading cause of mortality in those younger than 45 years of age [
1,
2]. Trauma remains a public health problem leading to disability and results in substantial socioeconomic burden [
2-
4]. To improve the quality of trauma care systems, various trauma scoring systems predicting morality have been used [
5-
8] with the Trauma and Injury Severity Score (TRISS) being the most commonly used methodology to predict trauma patient mortality [
9].
In developed countries, advanced trauma care systems decrease trauma mortality [
10,
11]. Disability from traumatic injury that requires long term medical care is a public health burden. To assess trauma care performance, a tool to predict functional outcome including disability is necessary. Previous work proposed scoring systems to predict return-to-work or quality of life after traumatic brain injury [
12,
13]. These methods, however, are limited to patients with traumatic brain injury and not feasible to assess the overall performance of trauma care systems in each community.
TRISS was proposed to predict the probability of survival following traumatic injury. It is a weighted combination of the Revised Trauma Score (RTS), the Injury Severity Score (ISS) and patient age. Beta coefficients for TRISS were derived from models in 1987 and revised in 2010 [
14]. To improve TRISS performance, coefficients were recalculated, continuous variables (e.g., age) were recalculated and comorbidity scores were added [
6,
15-
20]. Testing the predictive power of TRISS for disability, however, was not reported. If TRISS (or a similar type scoring system) was able to predict severe or worsening disability following trauma, it could be used to measure and improve trauma care systems’ performances and to prevent worsening functional outcomes in trauma patients.
The aim of this study was to develop a modified TRISS model predicting disability (TRISS-D) in acute trauma populations. We also sought to assess the discriminatory power of TRISS-D to predict severe disability or worsening disability after acute trauma.
METHODS
Study setting
This was a retrospective observational study using an emergency medical service (EMS) based severe trauma database collected by the Korea Centers for Disease Control and Prevention in South Korea [
21]. This study was approved by the institutional review board of Seoul National University Hospital (H-1206-024-412), and the informed consent was waived for minimal risk clinical investigation.
South Korean emergency departments (EDs) are categorized from level 1 to 4 based on available resources and specialty of care. Since 2012, the Korean government designated regional trauma centers among level 1 or 2 EDs. The Korean regional trauma centers are similar to level 1 and 2 trauma centers in the United States. In South Korea, a prehospital transport of severely injured patients is provided by fire departments which are publicly controlled and a single tiered model. The level of service is similar to an intermediate emergency medical technician. The Korean EMSs use a field triage protocol similar to the United States 2011 Centers for Disease Control and Prevention field triage guidelines [
21]. Every case transported by the fire department is recorded in the EMSs run-sheet. In cases of severely injured patients, an in-depth detailed report is provided by the emergency medical technician.
The database collected information on severely injured patients transported and treated by EMS providers. Data were collected in 10 of 17 South Korean provinces from January to December 2013. Database inclusion criteria consisted of severely injured patients with abnormal RTS or prehospital traumatic arrest. For eligible cases, trained medical record reviewers from the Korea Centers for Disease Control and Prevention visited each hospital and performed in-hospital medical record review following standard medical record review procedures. We performed regular quality improvement meetings to ensure data quality from the medical record review. Cases were excluded for any of the following: (1) RTS missing from the EMSs run-sheet, (2) not transported to the hospital, or (3) in-hospital medical record unavailable.
Participants
We included cases with traumatic injury mechanism among patients registered into EMS based severe trauma patients from 10 provinces in 2013. If injury mechanism was unknown or non-traumatic injury, they were excluded. If information about age, ISS, variables required for RTS calculation was missing, they were excluded.
Calculation of TRISS-D
Using systolic blood pressure, respiratory rate (RR), and Glasgow Coma Scale measured at ED arrival, RTS was calculated as follow: RTS=(0.9368×Glasgow Coma Scale score category)+(0.7326× systolic blood pressure)+(0.2908×RR). If variables for RTS at ED arrival were missing, we substituted the last variable from the EMS run-sheet measured during the prehospital phase. If RR at ED arrival was not assessed due to prehospital endotracheal intubation, we included the last RR from the EMS run-sheet. The Abbreviated Injury Score (AIS) and ISS for each case was calculated by medical record review following prior methodology. We categorized case severity as follows: mild trauma ISS <9, moderate trauma ISS 9–15, severe trauma 16–24, and fatal trauma ISS >24.
TRISS-D was modeled on severe disability after trauma. Disability after trauma was measured at hospital discharge by the Glasgow Outcome Scale (GOS) as follows: mortality, 1; vegetative state, 2; severe disability, 3; moderate disability, 4; and good recovery, 5. Age was categorized as <15, 15–54, and >54 years. We developed two models of TRISS-D. TRISS-D model 1 included penetrating or blunt injury. Model 2 used the presence of severe head injury defined as a head AIS score of 3 or more. A detailed equation for the TRISS-D model is as follows:
PSD=probability of severe disability defined (GOS from 1 to 3) Probability of good recovery=1-PSD=1/(1+e-b)
b=α+(β coefficient of RTS)×RTS+(β coefficient of ISS)×ISS+ (β coefficient of age)×age category.
Model 1 classified by injury mechanism (blunt versus penetrating injury). Model 2 classified by presence of severe head injury (head AIS score of 3 or more).
Outcome measure
The primary outcome was the discriminatory power of the TRISS-D to predict severe disability. We assessed the predictive power of both Model 1 and Model 2. The secondary outcome was the discriminatory power of the TRISS-D to predict worsening disability. Worsening disability was defined as a GOS at hospital discharge lower than the GOS prior to the traumatic event.
Validation and sensitivity analysis
We validated the TRISS-D internally using area under the receiver operating characteristic curve (AUC) with 95% confidence intervals (CI). We also conducted various sensitivity analyses. First, we assessed the discriminatory power for cases presenting to all EDs and then for only those presenting to level 1 or 2 EDs. Second, we compared discrimination of TRISS-D with TRISS coefficients derived from previous research using The Major Trauma Outcome Study (MTOS), The National Trauma Data Bank (NTDB) and the National Sample Project (NSP) [
14,
15]. We performed this process for both the entire cohort and those that survived to hospital discharge. Finally, we created a randomly sampled dataset with replacement. The predictive power of the models was assessed in both the original and randomly sampled datasets.
Demographic findings are described with simple descriptive statistics. We conducted chi-square tests for categorical variables. To assess TRISS-D predictive power, we measured the AUC and 95% CI of each TRISS-D model. To compare performance of TRISS-D and previously developed models from the MTOS, NTDB, and NSP, we compared the AUC value of each model and considered statistical significance for P-values <0.05. We compared the discriminative power of each model using the AUC value for the entire cohort and the cohort with survival discharge. To assess internal validity, we developed a randomly sampled dataset with 100,000 observations from the original dataset using 5 times sampling. Then we compared the predictive power of TRISS-D for both the original dataset and the sampled dataset. Data analysis was performed with SAS ver. 9.3 (SAS Institute, Cary, NC, USA).
RESULTS
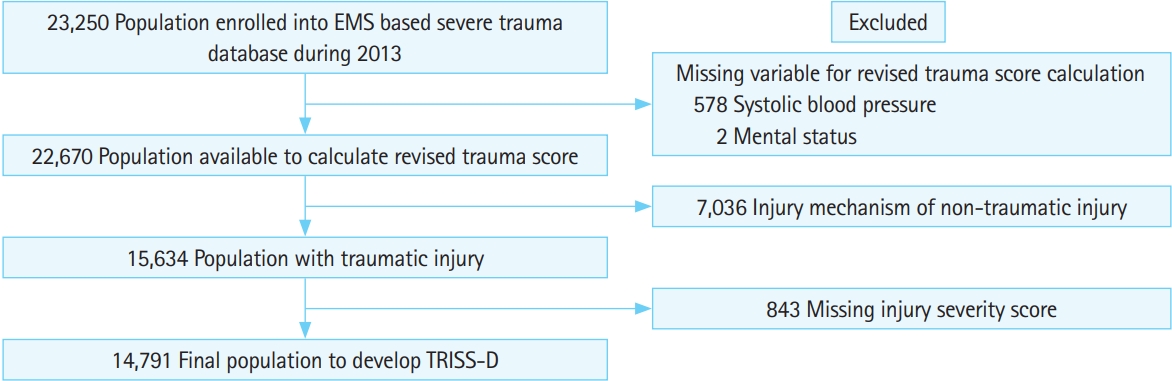
During the study, 23,250 cases were enrolled into the EMSs severe trauma database. Among these, 14,791 (63.6%) cases met inclusion criteria (
Fig. 1). Among these, 2,764 (19.0%) cases died and those that died were older (P=0.01), 3,757 (25%) cases had severe disability, and 6,018 (41%) cases had worsening disability (
Table 1). Components of the TRISS-D model stratified by the GOS are presented in
Table 2. Finally, we derived coefficients of the TRISS D-model using 14,791 cases by classification of injury mechanism or presence of severe head injury (
Appendix 1).
We validated the discriminatory power of the TRISS-D model internally. For severe disability, both TRISS-D models (injury mechanism and severe head injury) showed excellent prediction power with AUC values over 0.9 (
Table 3). The discriminatory power of the TRISS-D for worsening disability was very good with an AUC value more than 0.8. We assessed the prediction power for cases transported to level 1 or 2 EDs with AUC values over 0.9 for severe disability and over 0.8 for worsening disability.
We compared the prediction power for disability using coefficients of TRISS-D, MTOS, NTDB, and NSP projects in the entire cohort. For all population, TRISS-D (for severe head injury) showed higher performance than all other three models (P<0.01). Similarly, the performance of TRISS-D for worsening disability was better than the other three models (P<0.01) (
Table 4).
We also assessed the performance of TRISS-D and previously derived models for 12,027 cases surviving to hospital discharge. The AUC of TRISS-D for severe disability was higher than all three models (P<0.01). The prediction power of TRISS-D for worsening disability for the same population (survival to discharge) was higher than the other three databases (P<0.01) (
Table 5).
By using a random sampling method with replacement, 100,000 observation cases were extracted from the original dataset (
Table 6). We assessed performance of TRISS-D by injury mechanism or severe head injury for severe disability and worsening disability. Performance of TRISS-D was similar for the original dataset and randomly sampled dataset.
DISCUSSION
We developed a new model to predict disability in trauma patients using variables in the conventional TRISS model including age, RTS and ISS. The predictive power of the TRISS-D model for severe disability by both the injury mechanism and severe head injury categories was excellent. Similarly, the discriminative power of the TRISS-D model for worsening disability was very good for both categories. This new model could be used for measuring performance of trauma care systems for disability in different trauma systems.
Recently, functional outcome has become an important quality indicator. One-year disability after severe trauma measured by the EuroQol-5D reported more than 60% of patients had more than two positive findings of EuroQol-5D categories [
22]. Nearly half of admitted patients with traumatic brain injuries have trauma related disability at 1 year after the accident [
23]. In the United States, approximately 5.3 million cases have disability with activities of daily life following traumatic brain injury [
23,
24]. In this study, we developed a scoring system to predict disability after severe injuries. Previously reported research used detailed scoring tools to measure disability like the EuroQol-5D and the Health Utilities Index. Such methods, however, are not feasible to assess large populations in trauma care systems and compare performance in different communities. Because this investigation derived the TRISS-D model based on readily available data (age, ISS, and RTS), TRISS-D could be implemented easily for trauma systems using the TRISS scoring system.
We compared the predictive power for disability between the TRISS-D model and previously derived models. TRISS-D showed higher discriminative power for sever disability and worsening disability than previous models. Previous models derived from MTOS, NTDB and NSP projects calculated coefficients using mortality as the outcome variable. In this study, the outcome was severe disability (GOS 1–3) which includes death. Thus, the TRISS-D model showed improved performance compared to previous models. TRISS-D predicted severe disability better than it predicted worsening disability. TRISS-D was modeled to predict severe disability and not worsening disability thus it was anticipated to not perform as well for this outcome. Therefore, deriving new coefficients using an outcome variable of worsening GOS is required to improve performance of TRISS-D for predicting worsening disability.
This investigation has certain limitations. First, this study used an EMS based severe trauma database form South Korea and may not be generalizable to other locations. Second, the database used in the study was based on the EMS record and a retrospective review of hospital medical records. Prehospital data was often limited in its quality. Although we performed education and regular quality assessments, the study is limited by its retrospective nature. Abstractors were masked to prehospital data when they abstracted hospital data. Third, we did not add new variables such as physiologic data, laboratory results or comorbidities to TRISS-D. Adding new variables could improve performance of the scoring system but would likely sacrifice generalizability as this data is not always available.
In conclusion, we developed TRISS-D to predict severe disability and worsening disability after acute traumatic injury. TRISS-D showed excellent discriminative power predicting severe disability and had very good performance predicting worsening disability. Following validation in a separate database, TRISS-D could be utilized as a method to measure performance of trauma care systems.
NOTES
-
No potential conflict of interest relevant to this article was reported.
Fig. 1.Selection of the study population. EMS, emergency medical service; TRISS-D, Trauma and Injury Severity Score model predicting disability

Table 1.Demographic finding of study population
Table 1.
|
Variable |
Total population |
Outcome
|
P-value |
|
Survival |
Mortality |
|
No. of patients |
|
14,791 (100.0) |
12,027 (81.0) |
2,764 (19.0) |
|
|
Sex |
Male |
10,505 (71.0) |
8,505 (81.0) |
2,000 (19.0) |
0.09 |
|
Female |
4,286 (29.0) |
3,522 (82.2) |
764 (17.8) |
|
|
Age (yr) |
Mean ± SD |
48.5 ± 20.2 |
47.3 ± 20.2 |
53.7 ± 19.4 |
0.01 |
|
0–14 |
653 (4.4) |
594 (91.0) |
59 (9.0) |
< 0.01 |
|
15–54 |
8,306 (56.2) |
6,977 (84.0) |
1,329 (16.0) |
|
|
≥ 55 |
5,832 (39.4) |
4,456 (76.4) |
1,376 (23.6) |
|
|
Region |
Busan |
1,489 (10.1) |
1,210 (81.3) |
279 (18.7) |
< 0.01 |
|
Daegu |
1,411 (9.5) |
1,203 (85.3) |
208 (14.7) |
|
|
Incheon |
1,032 (7.0) |
836 (81.0) |
196 (19.0) |
|
|
Gwangju |
696 (4.7) |
587 (84.3) |
109 (15.7) |
|
|
Deajeon |
404 (2.7) |
283 (70.1) |
121 (30.0) |
|
|
Ulsan |
686 (4.6) |
546 (79.6) |
140 (20.4) |
|
|
Gyunggi |
4,377 (29.6) |
3,613 (82.6) |
764 (17.5) |
|
|
Gangwon |
1,094 (7.4) |
865 (79.1) |
229 (20.9) |
|
|
Chungnam |
1,616 (10.9) |
1,284 (79.5) |
332 (20.5) |
|
|
Jeonnam |
1,986 (13.4) |
1,600 (80.6) |
386 (19.4) |
|
|
Intent of injury |
Unintentional |
13,131 (88.8) |
10,866 (82.8) |
2,265 (17.3) |
|
|
Self-harm |
632 (4.3) |
392 (62.0) |
240 (38.0) |
|
|
Violence |
619 (4.2) |
570 (92.1) |
49 (7.9) |
|
|
Unknown |
409 (2.8) |
199 (48.7) |
210 (51.3) |
|
|
Level of EDs |
Level 1 |
2,666 (18.0) |
2,159 (81.0) |
507 (18.3) |
< 0.01 |
|
Level 2 |
6,161 (41.7) |
4,927 (80.0) |
1,234 (20.0) |
|
|
Level 3 |
4,744 (32.1) |
3,845 (81.1) |
899 (19.0) |
|
|
Level 4 |
1,220 (8.3) |
1,096 (89.8) |
124 (10.2) |
|
Table 2.Components of TRISS-D model according to Glasgow Outcome Scale
Table 2.
|
Total |
Glasgow Outcome Scale at hospital discharge
|
|
1 |
2 |
3 |
4 |
5 |
Unknown |
|
No. of patients |
14,791 (100) |
2,764 (19) |
227 (2) |
767 (5) |
2,878 (19) |
8,094 (55) |
61 (0) |
|
Glasgow Coma Scale |
|
|
|
|
|
|
|
|
3 |
547 (4) |
433 (79) |
31 (6) |
34 (6) |
24 (4) |
23 (4) |
2 (0) |
|
4–5 |
2,166 (15) |
1,746 (81) |
103 (5) |
96 (4) |
105 (5) |
106 (5) |
10 (0) |
|
6–8 |
1,670 (11) |
319 (19) |
63 (4) |
222 (13) |
411 (25) |
645 (39) |
10 (1) |
|
9–12 |
2,430 (16) |
134 (6) |
17 (1) |
167 (7) |
590 (24) |
1,510 (62) |
12 (0) |
|
13–15 |
7,978 (54) |
132 (2) |
13 (0) |
248 (3) |
1,748 (22) |
5,810 (73) |
27 (0) |
|
Systolic blood pressure (mmHg) |
|
|
|
|
|
|
|
|
0 |
2,021 (14) |
1,853 (92) |
38 (2) |
24 (1) |
28 (1) |
67 (3) |
11 (1) |
|
1–49 |
51 (0) |
28 (55) |
1 (2) |
5 (10) |
8 (16) |
9 (18) |
0 (0) |
|
50–75 |
499 (3) |
164 (33) |
20 (4) |
40 (8) |
148 (30) |
125 (25) |
2 (0) |
|
76–89 |
462 (3) |
76 (16) |
15 (3) |
39 (8) |
136 (29) |
195 (42) |
1 (0) |
|
> 89 |
11,758 (79) |
643 (5) |
153 (1) |
659 (6) |
2,558 (22) |
7,698 (65) |
47 (0) |
|
Respiratory rate (breaths/min) |
|
|
|
|
|
|
|
|
0 |
1,587 (11) |
1,523 (96) |
25 (2) |
17 (1) |
11 (1) |
10 (1) |
1 (0) |
|
1–5 |
4 (0) |
2 (50) |
1 (25) |
0 (0) |
0 (0) |
1 (25) |
0 (0) |
|
6–9 |
29 (0) |
19 (66) |
3 (10) |
4 (14) |
0 (0) |
3 (10) |
0 (0) |
|
10–29 |
10,855 (73) |
754 (7) |
145 (1) |
648 (6) |
2,419 (22) |
6,854 (63) |
35 (0) |
|
> 29 |
2,316 (16) |
466 (20) |
53 (2) |
98 (4) |
448 (19) |
1,226 (53) |
25 (1) |
|
Blunt injury |
14,129 (96) |
2,697 (19) |
226 (2) |
756 (5) |
2,791 (20) |
7,601 (54) |
58 (0) |
|
Severe head injury (AIS > 3) |
3,164 (21) |
920 (29) |
156 (5) |
434 (14) |
831 (26) |
806 (25) |
17 (1) |
|
Age category |
|
|
|
|
|
|
|
|
0–14 |
653 (4) |
59 (9) |
7 (1) |
20 (3) |
96 (15) |
469 (72) |
2 (0) |
|
15–54 |
8,306 (56) |
1,329 (16) |
116 (1) |
402 (5) |
1,569 (19) |
4,858 (58) |
32 (0) |
|
≥ 55 |
5,832 (39) |
1,376 (24) |
104 (2) |
345 (6) |
1,213 (21) |
2,767 (47) |
27 (0) |
|
Revised trauma score |
6.3 ± 2.3 |
2.4 ± 2.3 |
4.6 ± 1.9 |
6.3 ± 1.5 |
7.1 ± 1.1 |
7.4 ± 0.8 |
6.0 ± 2.2 |
|
Injury severity score |
8.6 ± 8.9 |
13.5 ± 10.9 |
17.3 ± 12.1 |
17.0 ± 10.5 |
10.8 ± 7.9 |
5.0 ± 5.8 |
8.3 ± 6.8 |
Table 3.Discriminatory power of the TRISS-D model
Table 3.
|
Model (n = 14,791) |
Number |
Outcome |
AUC |
95% CI |
AIC |
|
TRISS-D for severe disability |
|
|
|
|
|
|
|
Model classified by injury mechanism |
|
|
|
|
|
|
|
Level 1–4 EDs |
14,791 |
3,757 |
0.948 |
0.944–0.952 |
16,766 |
|
|
Level 1, 2 EDs |
8,827 |
2,318 |
0.942 |
0.936–0.947 |
10,167 |
|
Model classified by severe head injury |
|
|
|
|
|
|
|
Level 1–4 EDs |
14,791 |
3,757 |
0.950 |
0.946–0.954 |
16,766 |
|
|
Level 1, 2 EDs |
8,827 |
2,318 |
0.944 |
0.934–0.949 |
10,167 |
|
TRISS-D for worsening disability |
|
|
|
|
|
|
Model classified by injury mechanism |
|
|
|
|
|
|
|
Level 1–4 EDs |
14,791 |
6,018 |
0.810 |
0.803–0.817 |
19,991 |
|
|
Level 1, 2 EDs |
8,827 |
3,551 |
0.824 |
0.815–0.832 |
11,890 |
|
Model classified by severe head injury |
|
|
|
|
|
|
|
Level 1–4 EDs |
14,791 |
6,018 |
0.816 |
0.809–0.823 |
19,991 |
|
|
Level 1, 2 EDs |
8,827 |
3,551 |
0.828 |
0.819–0.837 |
11,890 |
Table 4.Comparison of the discriminatory power of the TRISS-D with previous models derived from MTOS, NTDB, and NSP databases
Table 4.
Model (n=14,791)
|
AUC |
95% CI |
AUC difference
|
|
Outcome |
Category |
Coefficient |
Estimate |
95% CI |
P-value |
|
Severe disability |
Severe head injury |
TRISS-D |
0.950 |
0.946–0.954 |
|
Reference |
|
|
MTOS |
0.937 |
0.932–0.941 |
0.007 |
0.006–0.009 |
< 0.01 |
|
NTDB |
0.929 |
0.924–0.934 |
0.014 |
0.012–0.016 |
< 0.01 |
|
NSP |
0.924 |
0.919–0.929 |
0.021 |
0.018–0.024 |
< 0.01 |
|
Injury mechanism |
TRISS-D |
0.948 |
0.944–0.952 |
|
Reference |
|
|
MTOS |
0.937 |
0.932–0.941 |
0.012 |
0.010–0.014 |
< 0.01 |
|
NTDB |
0.929 |
0.924–0.934 |
0.019 |
0.016–0.021 |
< 0.01 |
|
NSP |
0.924 |
0.919–0.929 |
0.024 |
0.021–0.027 |
< 0.01 |
|
Worsening disability |
Severe head injury |
TRISS-D |
0.816 |
0.809–0.823 |
|
Reference |
|
|
MTOS |
0.787 |
0.780–0.795 |
0.028 |
0.025–0.032 |
< 0.01 |
|
NTDB |
0.782 |
0.775–0.790 |
0.034 |
0.030–0.037 |
< 0.01 |
|
NSP |
0.782 |
0.774–0.789 |
0.034 |
0.030–0.038 |
< 0.01 |
|
Injury mechanism |
TRISS-D |
0.810 |
0.803–0.817 |
|
Reference |
|
|
MTOS |
0.787 |
0.780–0.795 |
0.022 |
0.019–0.025 |
< 0.01 |
|
NTDB |
0.782 |
0.775–0.790 |
0.027 |
0.024–0.031 |
< 0.01 |
|
NSP |
0.782 |
0.774–0.789 |
0.028 |
0.025–0.032 |
< 0.01 |
Table 5.Comparison of the discriminatory power of TRISS-D with previous models derived from MTOS, NTDB, and NSP databases for cohort surviving to discharge
Table 5.
Model (n = 12,027)
|
AUC |
95% CI |
AUC difference
|
|
Outcome |
Category |
Coefficient |
Estimate |
95% CI |
P-value |
|
Severe disability |
Severe head injury |
TRISS-D |
0.871 |
0.860–0.882 |
|
Reference |
|
|
MTOS |
0.830 |
0.817–0.844 |
0.041 |
0.034–0.047 |
< 0.01 |
|
NTDB |
0.821 |
0.808–0.835 |
0.049 |
0.042–0.057 |
< 0.01 |
|
NSP |
0.821 |
0.807–0.835 |
0.050 |
0.042–0.058 |
< 0.01 |
|
Injury mechanism |
TRISS-D |
0.865 |
0.854–0.877 |
|
Reference |
|
|
MTOS |
0.830 |
0.817–0.844 |
0.035 |
0.029–0.041 |
< 0.01 |
|
NTDB |
0.821 |
0.808–0.835 |
0.044 |
0.037–0.051 |
< 0.01 |
|
NSP |
0.821 |
0.807–0.835 |
0.044 |
0.037–0.051 |
< 0.01 |
|
Worsening disability |
Severe head injury |
TRISS-D |
0.771 |
0.762–0.780 |
|
Reference |
|
|
MTOS |
0.724 |
0.714–0.734 |
0.047 |
0.042–0.052 |
< 0.01 |
|
NTDB |
0.715 |
0.705–0.725 |
0.056 |
0.050–0.062 |
< 0.01 |
|
NSP |
0.713 |
0.703–0.723 |
0.058 |
0.052–0.064 |
< 0.01 |
|
Injury mechanism |
TRISS-D |
0.778 |
0.769–0.787 |
|
Reference |
|
|
MTOS |
0.724 |
0.714–0.734 |
0.037 |
0.032–0.041 |
< 0.01 |
|
NTDB |
0.715 |
0.705–0.725 |
0.046 |
0.041–0.051 |
< 0.01 |
|
NSP |
0.713 |
0.703–0.723 |
0.048 |
0.042–0.053 |
< 0.01 |
Table 6.Discriminatory power of the TRISS-D model using original dataset and the randomly sampled dataset
Table 6.
|
Outcome |
Model |
Dataset |
Number |
Disability (%) |
AUC |
95% CI |
|
Severe disability |
Injury mechanism category |
Original dataset |
14,791 |
3,757 (25.4) |
0.948 |
0.944–0.952 |
|
Sampled dataset |
100,000 |
25,407 (25.4) |
0.949 |
0.947–0.950 |
|
Severe head injury category |
Original dataset |
14,791 |
3,757 (25.4) |
0.950 |
0.946–0.954 |
|
Sampled dataset |
100,000 |
25,407 (8.3) |
0.951 |
0.949–0.952 |
|
Worsening disability |
Injury mechanism category |
Original dataset |
14,791 |
6,018 (40.7) |
0.810 |
0.803–0.817 |
|
Sampled dataset |
100,000 |
40,578 (40.7) |
0.809 |
0.806–0.811 |
|
Severe head injury category |
Original dataset |
14,791 |
6,018 (40.7) |
0.816 |
0.809–0.823 |
|
Sampled dataset |
100,000 |
40,578 (40.7) |
0.815 |
0.812–0.817 |
REFERENCES
- 1. Rhee P, Joseph B, Pandit V, et al. Increasing trauma deaths in the United States. Ann Surg 2014;260:13-21.
- 2. Lozano R, Naghavi M, Foreman K, et al. Global and regional mortality from 235 causes of death for 20 age groups in 1990 and 2010: a systematic analysis for the Global Burden of Disease Study 2010. Lancet 2012;380:2095-128.
- 3. Murray CJ, Vos T, Lozano R, et al. Disability-adjusted life years (DALYs) for 291 diseases and injuries in 21 regions, 1990-2010: a systematic analysis for the Global Burden of Disease Study 2010. Lancet 2012;380:2197-223.
- 4. Kim KS, Kim SD, Lee SH. Trend of mortality rate and injury burden of transport accidents, suicides, and falls. J Prev Med Public Health 2012;45:8-13.
- 5. Glance LG, Osler TM, Mukamel DB, Meredith W, Wagner J, Dick AW. TMPM-ICD9: a trauma mortality prediction model based on ICD-9-CM codes. Ann Surg 2009;249:1032-9.
- 6. Bergeron E, Rossignol M, Osler T, Clas D, Lavoie A. Improving the TRISS methodology by restructuring age categories and adding comorbidities. J Trauma 2004;56:760-7.
- 7. Lefering R, Huber-Wagner S, Nienaber U, Maegele M, Bouillon B. Update of the trauma risk adjustment model of the TraumaRegister DGU™: the Revised Injury Severity Classification, version II. Crit Care 2014;18:476.
- 8. Glance LG, Osler T. Beyond the major trauma outcome study: benchmarking performance using a national contemporary, population-based trauma registry. J Trauma 2001;51:725-7.
- 9. Boyd CR, Tolson MA, Copes WS. Evaluating trauma care: the TRISS method. Trauma Score and the Injury Severity Score. J Trauma 1987;27:370-8.
- 10. MacKenzie EJ, Rivara FP, Jurkovich GJ, et al. A national evaluation of the effect of trauma-center care on mortality. N Engl J Med 2006;354:366-78.
- 11. Polinder S, Haagsma JA, Lyons RA, et al. Measuring the population burden of fatal and nonfatal injury. Epidemiol Rev 2012;34:17-31.
- 12. Formisano R, Silvestro D, Azicnuda E, et al. Quality of life after brain injury (QOLIBRI): Italian validation of the proxy version. Intern Emerg Med 2017;12:187-98.
- 13. Chien DK, Hwang HF, Lin MR. Injury severity measures for predicting return-to-work after a traumatic brain injury. Accid Anal Prev 2017;98:101-7.
- 14. Schluter PJ, Nathens A, Neal ML, et al. Trauma and Injury Severity Score (TRISS) coefficients 2009 revision. J Trauma 2010;68:761-70.
- 15. Champion HR, Sacco WJ, Copes WS. Injury severity scoring again. J Trauma 1995;38:94-5.
- 16. Schluter PJ. Trauma and Injury Severity Score (TRISS): is it time for variable re-categorisations and re-characterisations? Injury 2011;42:83-9.
- 17. Gabbe BJ, Cameron PA, Wolfe R. TRISS: does it get better than this? Acad Emerg Med 2004;11:181-6.
- 18. Jones JM, Skaga NO, Sovik S, Lossius HM, Eken T. Norwegian survival prediction model in trauma: modelling effects of anatomic injury, acute physiology, age, and co-morbidity. Acta Anaesthesiol Scand 2014;58:303-15.
- 19. Kimura A, Chadbunchachai W, Nakahara S. Modification of the Trauma and Injury Severity Score (TRISS) method provides better survival prediction in Asian blunt trauma victims. World J Surg 2012;36:813-8.
- 20. Kimura A, Nakahara S, Chadbunchachai W. The development of simple survival prediction models for blunt trauma victims treated at Asian emergency centers. Scand J Trauma Resusc Emerg Med 2012;20:9.
- 21. Ahn KO, Kim SC, Park JO, Shin SD, Song KJ, Hong KJ. Validation of the criteria for early critical care resource use in assessing the effectiveness of field triage. Am J Emerg Med 2018;36:257-61.
- 22. Ringburg AN, Polinder S, van Ierland MC, et al. Prevalence and prognostic factors of disability after major trauma. J Trauma 2011;70:916-22.
- 23. Selassie AW, Zaloshnja E, Langlois JA, Miller T, Jones P, Steiner C. Incidence of long-term disability following traumatic brain injury hospitalization, United States, 2003. J Head Trauma Rehabil 2008;23:123-31.
- 24. Thurman DJ, Alverson C, Dunn KA, Guerrero J, Sniezek JE. Traumatic brain injury in the United States: a public health perspective. J Head Trauma Rehabil 1999;14:602-15.
Appendices
Appendix 1.
- Variables and coefficients of TRISS-D model (n=14,791)
Table
|
Variable and coefficient
|
|
α |
β-RTS |
β-ISS |
β-age |
|
Model 1 classified by injury mechanism |
|
|
|
|
|
0–14 yr |
-3.0710 |
1.0371 |
-0.1227 |
- |
|
Blunt, 15–54 yr |
-3.5817 |
1.0317 |
-0.1067 |
- |
|
Penetrating, 15–54 yr |
-2.8782 |
0.9959 |
-0.0784 |
- |
|
Blunt, ≥ 55 yr |
-3.5817 |
1.0317 |
-0.1067 |
-0.7084 |
|
Penetrating, ≥ 55 yr |
-2.8782 |
0.9959 |
-0.0784 |
-0.3757 |
|
Model 2classified by presence of severe head injury |
|
|
|
|
|
0–14 yr |
-3.0710 |
1.0371 |
-0.1227 |
- |
|
Severe head injury, 15–54 yr |
-3.4214 |
0.8528 |
-0.0614 |
- |
|
No severe head injury, 15–54 yr |
-0.1485 |
0.6116 |
-0.1195 |
- |
|
Severe head injury, ≥ 55 yr |
-3.4214 |
0.8528 |
-0.0614 |
-0.4808 |
|
No severe head injury, ≥ 55 yr |
-0.1485 |
0.6116 |
-0.1195 |
-0.1449 |


 , Sang Do Shin1,2, Young Sun Ro1,2, Jeong Ho Park1,2, Seung Chul Lee2,4, Chu Hyun Kim2,5