Changes in the first-pass success rate with the GlideScope video laryngoscope and direct laryngoscope: a ten-year observational study in two academic emergency departments
Article information
Abstract
Objective
The aim of this study was to assess the success rate of the GlideScope video laryngoscope (GVL) and direct laryngoscope (DL) over ten years in two academic emergency departments.
Methods
We used adult intubation data using DL and GVL collected from airway management registries at two academic emergency departments. We analyzed changes in first-pass success (FPS) rate by device and operator training level. We conducted a multivariate logistic regression analysis to predict the FPS according to time period.
Results
Over the study period (2006 to 2010, season I; 2013-2015, season II) the DL usage rate dropped from 91.6% to 45.0% while the GVL usage rate increased from 8.4% to 55.4%. The FPS rate using DL also declined from 90.8% in 2007 to 75.5% in 2015. On the other hand, the FPS rate using GVL increased from 87.8% to 95.2%. With DL, all operators’ FPS rate declined by approximately 10% in season II compared to season I. The FPS rate with GVL was significantly higher in the providers of postgraduate year over 3 years (P=0.043). Multivariate logistic regression analysis revealed an adjusted odds ratio for GVL FPS of 0.799 during season I (P=0.274). However, the adjusted odds ratio for GVL FPS was 3.744 during season II (P<0.001).
Conclusion
We found that the FPS rates of GVL have slightly increased but DL’s FPS rate has significantly decreased during the last ten years.
INTRODUCTION
The GlideScope video laryngoscope (GVL; Verathon Medical, Bothell, WA, USA) is the most commonly used device for emergency intubations [1]. Some previous comparative studies showed the GVL outperformed the direct laryngoscope (DL) in terms of glottis visualization, but there was little difference in success rate between the two methods [1-6]. These studies were limited by the fact that the analyses were performed shortly after introduction of the GVL into clinical research training. Although the GVL has been used since 2001, it is still regarded as a relatively new device compared to a conventional DL.
The National Emergency Airway Registry (NEAR) group reported that GVL use has been dramatically increasing in emergency departments (EDs) [7]. Sakles et al. [8] reported that GVL performance has significantly improved over the past seven years. It is assumed that a similar phenomenon is observed in other EDs. Alteration in performance and usage frequency of GVL may be inversely related to those of DL [5]. Though previous studies showed the overall performance of GVL was not significantly superior to DL, the changes of usage frequency and performance of these two devices in recent years can alter the DL’s equivalence with GVL. The goal of this study was to assess changes of usage frequency and intubation success rates during a first attempt using GVL and DL over ten years in two academic EDs.
METHODS
Study design and setting
This study was a retrospective analysis of data from prospective airway registries at two academic EDs. Each ED was equipped with identical GVLs, including a specialized rigid stylet (GlideRite; Verathon Medical, Bothell, WA, USA), and German-type Macintosh laryngoscope with fiberoptic light source. Each ED had an average of 36,000 to 40,000 patient visits annually. Both EDs were operating four-year emergency medical residency training programs, and all residents rotated between the two EDs. All emergency physicians participated in three (fundamental, basic, and advanced) simulation-based airway management training courses before starting live intubation. Most tracheal intubations in both EDs were performed by emergency physicians (residents and attending physicians). When relatively under-experienced physicians (postgraduate year [PGY] I and II) attempted endotracheal intubation (ETI), senior emergency physicians usually supervised their practices.
Study population
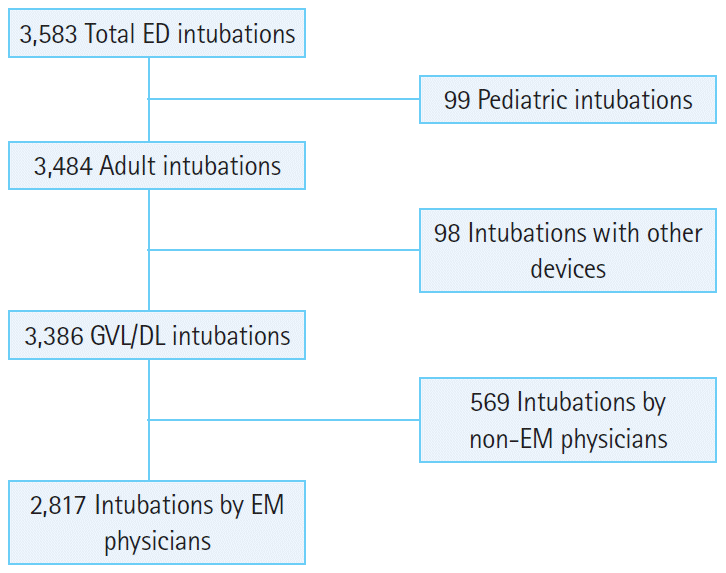
Patients older than 18 years who underwent oral ETI at both EDs during the study period were included in this study. The exclusion criteria included cases in which surgical methods and extraglottic devices were used on the first intubation attempt. We excluded cases in which the first operator was not an emergency physician because other specialty operators rarely use DL at these institutions (Fig. 1).
Data collection
Each emergency physician completed an airway registry form, which was developed based on a consensus of the Korean Emergency Airway Management Society investigators [1]. This airway registry was run on two separate occasions in both EDs (season I, January 2006 to December 2010; season II, January 2013 to December 2015). This prospective airway registry and this retrospective study were approved by the ethics committee in two hospitals. After ETI, the intubator recorded the intubation information on the form. All recorded forms were examined by the supervising investigators and entered into the web-based registry. All authors examined the completeness of the registry and reviewed the original data forms before analysis. All operators received instruction regarding the definitions of all study variables before collecting data. The completed datasheet was examined by the investigator at each ED, and the data was subsequently entered into an internet database. Author HJC monitored for the completeness of data collection during the research period.
Variables
We examined the following variables: patient sex/age, indications for intubation, difficulty of glottis exposure, crash airway, clinical experience of operators, intubation method, device used on first attempt, first-pass success (FPS) or failure, and glottis exposure grade. A ‘crash’ airway was defined as a situation in which the patient was in cardiac arrest or did not respond to any stimulation including laryngoscopy. A predicted difficult airway was defined according to the assessment method for difficult glottis exposure with laryngoscopy (look externally, evaluate mouth opening, thyromental distance, hyothyroidal distance, morbid obesity, airway obstruction, and neck mobility [LEMON] mnemonic) [9]. We used the Cormack-Lehane classification for glottis exposure grade [10].
Outcomes
The primary outcome was success on the first attempt (FPS). An attempt was defined as a single effort to place an airway.
Statistical methods
IBM SPSS ver. 21 (IBM Corp., Armonk, NY, USA) was used for all statistical analyses. Age was presented as mean and standard deviation, and other descriptive data are presented as frequencies and percentages. To investigate changes over time, we analyze all variables by registry season, because the two registries run individually at 2 year intervals of time. We selected the following variables as potential factors that could influence FPS: sex, age, hospital, crash airway, indication for intubation, difficult glottis exposure, glottis exposure grade, and intubation method. These potential factors and the FPS rate were compared using the chi-square test. We selected variables for the multivariate logistic regression model to identify the factors that have independent effect on FPS. These variables included those having significant effects on FPS in univariate analysis and those we considered clinically significant—age (over 65 or not) and sex. Then we performed a stratified analysis among these selected independent variables and looked for the effect of modification factors based on the homogenicity of the odds ratios (ORs) by the Breslow-Day test in order to select variables for the multivariate logistic regression model. After that, we used multivariate logistic regression analysis to identify variables that have independent effect on FPS. The P-value for statistical significance was set at 0.05.
RESULTS
During the study period, we recorded 3,386 of 3,484 (97.2%) adult ETI cases for whom DL or GVL was used. Emergency physicians were the first operators in 2817 (83.2%) cases (Fig. 1). Of these, we included 1,896 intubations in season I and 921 intubations in season II in our final analysis.
Table 1 shows the difference in distribution of variables potentially associated with FPS rate between season I and season II. GVL intubations comprised 48.0% of cases in season II, which is almost twice as high as the rate of that (24.4%) in season I. DL use decreased from 91.6% to 45.0%, while GVL usage increased from 8.4% to 55.4% over the ten-year period. There was no significant difference by gender; however, the mean age of patients was 57 (standard deviation±17.1) years and 63 (standard deviation ±16.8) years in season I and season II, respectively (P<0.001). In terms of the indications for intubation, trauma was far more frequent in season I than in season II (P<0.001), and indications in season I and season II were significantly different (P<0.001). There was no significant difference in the frequency of crash airways between season I and season II (P=0.292). Expected difficult glottis exposures in season I and season II did not differ (P=0.523). However, the rate of rapid sequence intubation (RSI) was 54.3% in season II compared to 42.4% in season I (P<0.001). There was 85.3% Cormack-Lehane I/II in season I and 91.0% in season II (P<0.001). Level of the first operator differed significantly between season I and season II; PGY 1 was the most frequent in season I (P<0.001); however, the frequency of PGY 1, PGY 2, and PGY 3 and greater did not differ in season II.
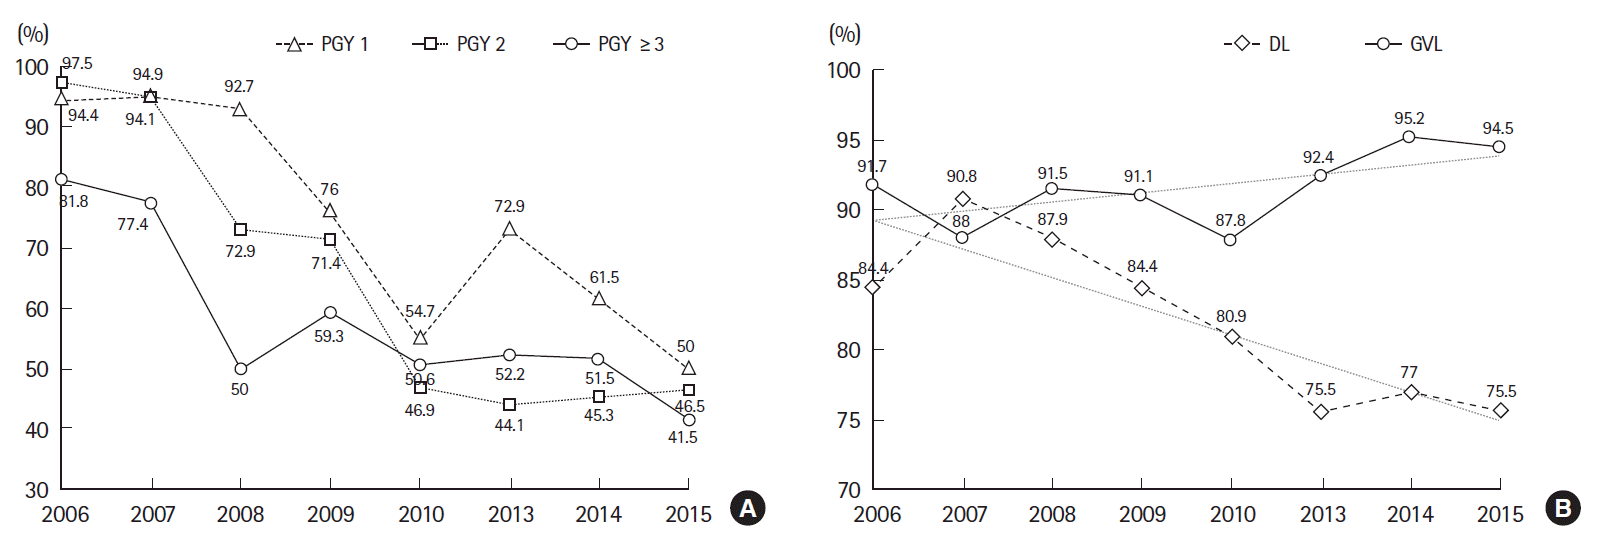
Over the ten-year period, there were changes in the frequency of DL use on the first attempt and FPS rate (Fig. 2). In 2006, 91.6% of emergency physicians chose DL on the first attempt, regardless of their training level; however, DL use fell to 45% in 2015. Consistent with the decrease in the frequency of DL use, the FPS rate using DL also declined from 90.8% in 2007 to 75.5% in 2015. On the other hand, the FPS rate using GVL increased. Comparisons of GVL and DL between season I and season II revealed that the FPS rate with the GVL increased from 89.6% to 94.8% (P=0.004) as did the frequency of more favorable glottis views (Cormack-Lehane I and II) from 93.3% to 98.2% (P<0.001). In contrast, the DL FPS rate decreased from 86.1% in season I to 76.2% in season II, and the frequency of favorable glottis views did not differ significantly between season I and season II (P=0.439) (Table 2).

Change in rate of direct laryngoscope use (A) and first-pass success rate using the GlideScope video laryngoscope and direct laryngoscopy (DL) (B) over ten years. PGY, postgraduate year; GVL, GlideScope video laryngoscope.
Table 3 provides an overview of the changes in FPS rate over time by operator level. The DL FPS rate declined by approximately 10% in season II compared to season I across all levels of emergency physician. The FPS rate with GVL, on the other hand, increased slightly among PGY 1 and PGY 2 physicians, but the difference was not significant (P=0.237 and P=0.145, respectively). However, there was a significant increase in GVL FPS rate among PGY 3 and greater physicians (P=0.043).

Comparison of first-pass success rate of GlideScope and DL according to operators’ level of experience between season I and II
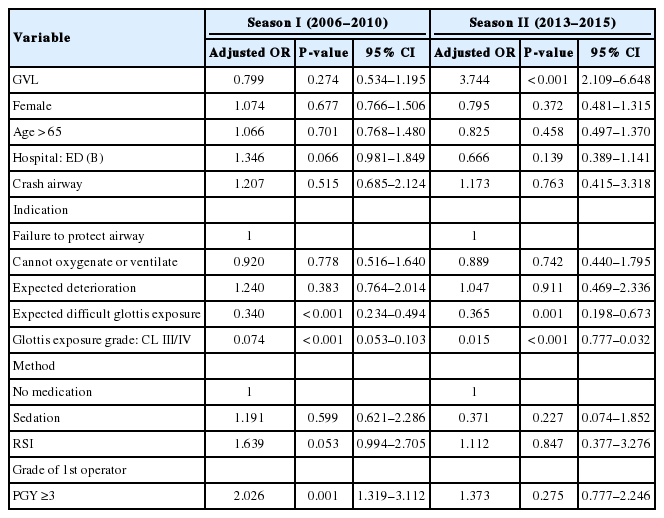
Table 4 shows the results of multivariate logistic regression analysis for predicting FPS rate according to time period. During season I, the adjusted OR of GVL FPS rate was 0.799, and this result was not statistically significant (P=0.274). However, the adjusted OR of GVL FPS rate was 3.744 during season II, and it was statistically significant (P<0.001). The expected glottis exposure and glottis exposure grade had a significant independent effect on FPS during both seasons. If the first operator was a PGY 3 or greater, the OR for FPS was significant in season I (OR, 2.026; confidence interval, 1.319 to 3.112; P<0.001), but not in season II (OR, 1.373; confidence interval, 0.777 to 2.246; P=0.275).
DISCUSSION
This study was conducted using an airway registry maintained in two academic EDs. We used logistic regression analysis of the registry data by time change (season I and II) because we found that circumstances surrounding intubation differed significantly between season I and season II. Over the ten-year period documented by the registry, we observed some notable changes in airway management associated with the rate of RSI, grade of the first operator and type of device used between the two seasons. The rate of RSI increased from 42.4% to 54.3%, but after excluding cases of crash airway that did not require RSI, the rate of RSI rose from 75.5% to 93.2%. The increase in the rate of RSI in our study might be attributed to critical factors such as registry management providing feedback on RSI and continuous education including a member of Korean Emergency Airway Management Society in order to boost the implementation of RSI. With regard to the first operator’s level of experience, there was a higher percentage of first operators with little experience (PGY 1) in season I, but there was a higher rate of senior operators such as PGY 3 and greater performing the first intubation in season II. Above all, the biggest change we observed over the ten-year study period was the equipment selected for the first attempt. The two academic EDs participating in this study began using the GVL immediately after its introduction in 2006 and thus many of the physicians are skilled with this method. Over time, the preference for GVL has increased because it enables a good view of the glottis, is easy to learn, and is used more frequently than DL. One odd case of a temporary increase in DL use was observed in 2013, which was attributed to the fact that some faculty felt it would be difficult for operators to maintain appropriate DL technique due to the gradual decrease in its frequency of use and therefore they instructed emergency medicine residents, particularly PGY 1, to use DL preferentially. However, this intentional action ultimately did not change operator preference. Eventually the GVL was used more often than DL in 2015 and this trend is likely to continue in the future.
The less a medical device is used, the less experience can be gained, and the converse may be true. Previous studies have shown that the GVL provides better glottis views than DL, and it is easier for a physician even with little intubation experience to learn the GVL procedure than conventional laryngoscopy [2,4]. However, despite these advantages over DL, the overall performance of the GVL is not superior to that of DL [1,2,4,5]. The most likely reason for this result is that an experienced operator optimizes his or her ability to overcome the disadvantages of conventional intubation methods with DL [1-3,5,6,11-13]. In this study, the FPS rate with DL dropped from 86.1% to 76.2%. We assumed that it is mostly due to decreased frequency of DL usage. In the same context, it is reasonable to assume that the increased GVL’s FPS rate (89.6% to 94.8%) was due to increasing frequency of GVL usage. These phenomenon may contribute to the selection of GVL becoming the most effective factor for FPS in season II.
We found in our study that the level of the first operator rarely affected success rate, as the success rate of GVL performed by PGY 1 and PGY 2 physicians increased alongside an increase in the frequency of GVL. In contrast, the decreased number of DL attempts by PGY 3 and over decreased the DL success rate.
Other researchers have reported that use of video laryngoscopy including the GVL has been rapidly increasing [7,8,14]. In our analysis, a greater than 90% FPS rate was observed with GVL regardless of the operator’s level of training; therefore, we presume that the GVL will be a routinely recommended device, not an alternative device or first choice only for special situations. We also found that the LEMON mnemonic and good glottis exposure remain critical factors in determining FPS, irrespective of the device type. Thus, we believe that assessment using the LEMON mnemonic is needed for the GVL.
There are several limitations to this study. First, we used registry data for ETIs performed at just two academic EDs in Korea. Thus, these results may not be generalizable to all ED settings. In addition, we did not attempt to collect data on other variables (patients, operators, and environmental factors) that could potentially affect the FPS rate. Last, there could have been operator bias given that the data were self-reported.
We found over a ten-year period that the DL’s FPS rate decreased along with its frequency of use, and more and more operators used the GVL, and the success rate increased. The FPS rate of the GVL has become significantly higher than that of DL, particularly over the last two years. This seems to be associated with changing frequency of usage of the two devices.
Notes
No potential conflict of interest relevant to this article was reported.
References
Article information Continued
Notes
Capsule Summary
What is already known
The direct laryngoscope is still mainly used for emergency endotracheal intubation and its perforamance is not significantly inferior than the GlideScope.
What is new in the current study
The Glidescope has been popularly used for emergency endotracheal intubation in recent years. The performance of the GlideScope has increased but the direct laryngoscope’s performance has significantly decreased during the last ten years.


