Is it possible to reduce intra-hospital transport time for computed tomography evaluation in critically ill cases using the Easy Tube Arrange Device?
Article information
Abstract
Objective
Patients are often transported within the hospital, especially in cases of critical illness for which computed tomography (CT) is performed. Since increased transport time increases the risks of complications, reducing transport time is important for patient safety. This study aimed to evaluate the ability of our newly invented device, the Easy Tube Arrange Device (ETAD), to reduce transport time for CT evaluation in cases of critical illness.
Methods
This prospective randomized control study included 60 volunteers. Each participant arranged five or six intravenous fluid lines, monitoring lines (noninvasive blood pressure, electrocardiography, central venous pressure, arterial catheter), and therapeutic equipment (O2 supply device, Foley catheter) on a Resusci Anne mannequin. We measured transport time for the CT evaluation by using conventional and ETAD method.
Results
The median transport time for CT evaluation was 488.50 seconds (95% confidence interval [CI], 462.75 to 514.75) and, 503.50 seconds (95% CI, 489.50 to 526.75) with 5 and 6 fluid lines using the conventional method and 364.50 seconds (95% CI, 335.00 to 388.75), and 363.50 seconds (95% CI, 331.75 to 377.75) with ETAD (all P<0.001). The time differences were 131.50 (95% CI, 89.25 to 174.50) and 148.00 (95% CI, 116.00 to 177.75) (all P<0.001).
Conclusion
The transport time for CT evaluation was reduced using the ETAD, which would be expected to reduce the complications that may occur during transport in cases of critical illness.
INTRODUCTION
Most hospitalized patients receive intravenous hydration, electrolytes, medications, nutrients, and blood transfusions [1,2]. Patients with serious conditions receive a larger number of intravenous infusions than those with less severe conditions and require additional devices in order to monitor electrical activity in the heart, O2 saturation, blood pressure, central venous pressure, and arterial pressure. The patients in those states are transported between various places within the hospital for additional testing or treatment, which can cause numerous complications ranging from minor to life-threatening [3-9]. One report stated that the likelihood of those complications increases as the transport time or number of fluids attached to the patient increases [10].
According to the research by Parmentier-Decrucq et al. [11], 120 of 262 patients (45.8%) had complications during transport, to computed tomography (CT) in 93.6% of cases, followed by magnetic resonance imaging, angiography, and nuclear medicine testing [12].
Nurses are often charged with patient transport. One report stated that, next to checking vital signs, patient transport is the most frequent activity performed by nurses [13]. Therefore, nurses inevitably bear the burden of organizing the monitoring devices and fluid lines during patient transport.
Therefore, this study aimed to compare the time required for transport to CT, the most common reason for patient transport within the hospital, with versus without the use of the Easy Tube Arrange Device (ETAD) developed in a previous study; examine the complications that occur during patient transport; and verify the convenience of the newly developed ETAD.
METHODS
Participant
This study, which received institutional review board approval, included 60 volunteers who were responsible for patient transport, including nurses, emergency technicians, and doctors. The profession, sex, and length of employment of the volunteers were recorded.
Newly developed ETAD
To withstand the weight of the fluids, a 400 mm×400 mm×5 mm-thick acrylic plate was attached with a 500 mm×500 mm×3 mm-thick ethylene-vinyl acetate copolymer plate on each side. Three fluid bags were attached to each plate, with clips under the plates to hold the fluid lines and an attached flexible cable cut on one side to organize the fluid lines. To overcome the shortcoming of the inability to identify the fluid line in the flexible cable, each line was marked at the start and the end of the flexible cable with distinctive colors for identification (Fig. 1).
Set up of fluids and lines on the Easy Tube Arrange Device.
Study protocol
Each participant attached an electrocardiogram, O2 saturation measuring device, automatic blood pressure measuring device, central venous pressure measuring device, continuous arterial pressure monitor, oxygen supply, and Foley catheter to an ordinary CPR manikin (Resusci Anne, Laerdal Medical, Stavanger, Norway). In the starting setting, the conventional method or ETAD was used to organize the fluid lines. Each manikin was treated and attached with IV fluids as a patient in the intensive care unit (ICU) would be treated by the ICU nurse. For each method, a total of five or six fluids were attached, making a total of four different settings (three fluids; one for measuring central venous pressure, one for maintaining arterial cannulation, and one for peripheral venous fluid were used as the default). The central venous line was connected to the right subclavian vein, while the arterial maintaining line was connected to the left radial artery. The remaining intravenous fluids are connected to both arms. The number of fluids was selected as five or six which was determined as statistically significant in the previous study [14].
The time intervals from the starting position to the six steps was measured in seconds. The time spent by each participant to perform the step of moving fluids and monitoring devices from the default position (Fig. 2A) to the gurney (Fig. 2B) for patient transport (A period), the step of transporting the patient in the gurney from the ICU to the CT room (B period), the step of moving the patient from the gurney (Fig. 2C) to the CT bed (Fig. 2D) (C period), the step of moving the patient from the CT bed (Fig. 2D) to the gurney (Fig. 2C) (D period), the step of transporting the patient from the CT room to the ICU (E period), and the step of returning to the starting position (Fig. 2A) from the gurney (Fig. 2B).
Resusci Anne with medical fluid lines and monitoring systems. (A) Starting position in intensive care area. (B) Patient ready to go computed tomography (CT) room in intensive care area. (C) Patient arriving at the CT room. (D) Patient on CT table. A period (A→B), B period (B→C), C period (C→D), D period (D→C), E period (C→B), and F period (B→A).
The test was carried out using the conventional method or the ETAD by using five or six fluids each. The data recording sheet with a random order of settings and the number of fluids was randomly selected by the participant before the start of the test.
The time elapsed for each step was measured from the moment the participant handled the fluid, vital sign monitoring device, or therapeutic device to prepare for the transport to the moment the participant stopped handling the fluid, vital sign monitoring device or therapeutic device (A, C, D, and F period), and the transport time was measured based on the moment the gurney passed through the ICU door and the moment the gurney passed through the CT room door. All six steps were individually measured using conventional method or ETAD, with five or six fluid lines for each case and measured in seconds rounded to the first decimal place.
The complications encountered during the study were divided into detachment of the fluid line, detachment of the monitoring device, and dropping of the fluid, monitoring device, or ETAD. Finally, the participants were asked to score the convenience of the conventional method and ETAD on scale of 0 to 10 from most uncomfortable to most comfortable, respectively.
For the statistical analysis, IBM SPP Statistics ver. 21.0 (IBM Corp., Armonk, NY, USA) was used and the normality test for each variable was performed using the Shapiro-Wilk test. For analysis of the time elapsed for each group, a paired t-test was used to examine normally distributed variables while the Wilcoxon signed rank test was used to examine non-normally distributed variables. For analysis of the participants’characteristics and the time elapsed for each group, the Mann-Whitney U-test and independent twosample test were used for sex and one-way analysis of variance was used for occupation. Spearman’s correlation coefficient was used to compare employment lengths. To analyze complications, the chi-square test was used, and P-values <0.05 were considered statistically significant.
RESULTS
Participant demographics
This study included 60 volunteers comprising nurses, emergency personnel, and doctors working at Chungnam National University Hospital, Daejeon, Korea between July 30 to August 15, 2016. The participants comprised 20 men (33.33%) and 40 women (66.67%); 37 were nurses (61.67%), 12 were emergency medical technicians (20.00%), and 11 were doctors (18.33%). The average participant employment length was 29.28±21.40 months (Table 1).

Volunteer’s general characteristics
Comparison of time required to prepare patient transport by using conventional versus the ETAD method (A period)
The median and the inter quartile range of the time required to prep the five fluid lines using the conventional method was 178.00 seconds (95% confidence interval [CI], 165.25 to 187.75), while that for prepping six fluid lines was 185.48±11.69 seconds. Using ETAD, the time required to prep to the standard state was 124.00 seconds (95% CI, 110.25 to 139.00) and 120.53±19.67 seconds, respectively, and the differences were statistically significant (all P<0.001) (Table 2).

Comparison of time required using conventional versus ETAD method based on number of lines
Comparison of time required to transport patient from ICU to CT room by using conventional versus ETAD method (B, E periods)
For the conventional method, the time required to transport the patient from the ICU to the CT room for five fluid lines was 20.50 seconds (95% CI, 19.00 to 21.00) and that for six fluid lines was 21.00 seconds (95% CI, 19.00 to 21.00), while the time required to transport from the CT room back to the ICU was 21.00 seconds (95% CI, 20.00 to 22.00) regardless of the number of fluid lines. When ETAD was used, the time required to transport the patient from the ICU to the CT room was 21.00 seconds (95% CI, 20.00 to 22.00) regardless of the number of fluid lines, while the time required to transport from the CT room back to the ICU was 20.50 seconds (95% CI, 19.00 to 21.00) and 21.00 seconds (95% CI, 20.00 to 22.00), and the differences were not statistically significant (P=0.076, P=0.122, P=0.054, P=0.952, respectively) (Table 2).
Comparison of time required to transport patient from gurney to CT room and CT room to gurney by using conventional versus ETAD method (C, D periods)
Using the conventional method, the time required to transport a patient from the gurney to the CT bed was 48.62±7.49 and 46.82±7.60 seconds, respectively, while that using the ETAD method was 35.62±5.71 and 34.70±4.90 seconds, the differences of which were statistically significant (P<0.001). Using the conventional method, the time required to transport a patient from the CT bed back to the gurney was 47.60±7.19 and 44.50 seconds (95% CI, 41.00 to 49.00), while that using the ETAD method was 34.85±4.74 and 33.00 seconds (95% CI, 31.00 to 36.00), the differences of which were statistically significant (all P<0.001) (Table 2).
Comparison of time required to return to starting point after ICU arrival by using conventional versus ETAD method (F period)
Using the conventional method, the time required to return the patient to the starting point was 174.00 seconds (95% CI, 164.00 to 182.00) and 186.00 seconds (95% CI, 175.00 to 192.00) respectively for 5 and 6 fluid lines, while that using the ETAD was 123.00 seconds (95% CI, 108.75 to 137.00) and 122.00 seconds (95% CI, 108.25 to 133.50) respectively for 5 and 6 fluid lines, the differences of which were statistically significant (all P<0.001) (Table 2).
Comparison of total time required for intra-hospital transport based on method and number of fluid lines
Using the conventional method, the total transport time for five fluid lines was 489.00±38.66 seconds, while that for six fluid lines was 504.80±29.04 seconds, and the differences were statistically significant (P<0.004).
Using ETAD, the total transport time for five fluid lines was 364.50 seconds (95% CI, 335.00 to 388.75), while that for six fluid line transport was 363.50 seconds (95% CI, 331.75 to 377.75), and the differences were not statistically significant (P<0.101).
Comparison of total time consumed for intra-hospital transport by using conventional versus ETAD method in same fluid state
Using the conventional method, the total time consumed for the transport was 488.50 seconds (95% CI, 462.75 to 514.75) and 503.50 seconds (95% CI, 489.50 to 526.75) for five and six lines of transport, respectively, while that using the ETAD, was 364.50 seconds (95% CI, 335.00 to 388.75) and 363.50 seconds (95% CI, 331.75 to 377.75) for five and six lines of transport respectively; the differences of which were statistically significant (all P<0.001) (Table 2). The difference in transport time was 131.50 (95%, CI, 89.25 to 174.50) for five fluid lines and 148.00 (95% CI, 116.00 to 177.75) for six fluid lines, and the differences were statistically significant (all P<0.001).
Comparison of total time consumed for intra-hospital transport by using the conventional versus ETAD method based on participant demographics
The total time consumed to prepare the transport and return to the initial status using the conventional method for men was 492.30±34.68 and 513.20±33.13 seconds respectively for 5 and 6 fluid lines, while that for women was 487.58±40.84 and 500.60±26.21 seconds, the differences of which were not statistically significant (P=0.642, P=0.148). When ETAD was used, the total time for men was 333.00 seconds (95% CI, 311.50 to 369.00) and 343.50 seconds (95% CI, 301.00 to 369.00), while that for women was 374.50 seconds (95% CI, 344.50 to 391.50) and 367.50 seconds (95% CI, 342.50 to 383.50), the differences of which were statistically significant (P=0.006, P=0.050) (Table 3).
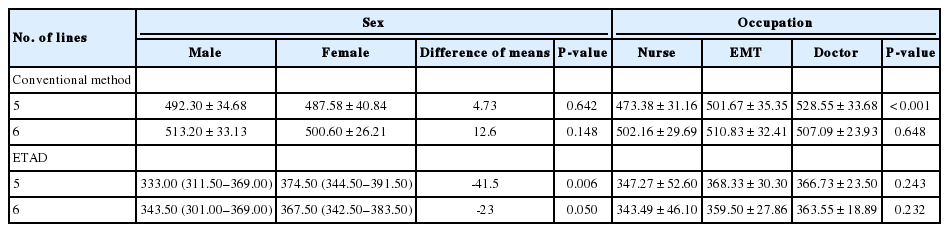
Comparison of total time required using the conventional versus ETAD method based on characteristics
By profession, the total time using the conventional method for nurses was 473.38±31.16 and 502.16±29.96 seconds for five and six fluid lines, respectively, while that for the emergency medical technicians was 501.67±35.35 and 510.83±32.41 seconds for the five and six fluid lines, respectively, and the differences were statistically significant for the five fluid lines (P<0.001), but not for the six fluid lines (P=0.648). When ETAD was used, the total time for the nurses was 347.27±52.60 and 343.49±46.10 seconds, respectively, 368.33±30.30 and 359.50±27.86 seconds for emergency medical technicians, and 366.73±23.50 and 363.55±18.89 seconds for doctors, and the differences were not statistically significant (P=0.243, P=0.232) (Table 3).
Regarding employment length, novice means less than average time (29.28 months) of employment, while expert means more. Using the conventional method, the total for transport time for novices was 484.00 seconds (95% CI, 453.00 to 521.00) and 503.00 seconds (95% CI, 488.50 to 529.50), respectively, while that for experts was 490.50 seconds (95% CI, 465.00 to 513.25) and 503.50 seconds (95% CI, 491.75 to 523.25), respectively. Using the ETAD, the total transport time for novices was 370.00 seconds (95% CI, 331.00 to 387.00) and 359.00 seconds (95% CI, 327.50 to 371.50), respectively, while that for experts was 354.50 seconds (95% CI, 340.25 to 389.00) and 365.00 seconds (95% CI, 337.75 to 379.75), respectively. The differences based on length of employment were not statistically significant (Table 4).

Comparison of total time required using the conventional versus ETAD method based on length of employment
The correlation analysis of employment length showed that the correlation coefficient of the total time consumed using the conventional method was -0.163 and -0.730, respectively, for five and six fluid lines (P=0.215, P=0.580), while that for ETAD was -0.360 and 0.052, respectively, which implied that employment length and total time consumed do not have a meaningful correlation (P=0.784, P=0.695) (Table 4).
Frequency of complications using the conventional versus ETAD method
For the five fluid line setting, a total of ten complications occurred with the use of the conventional method, including three of fluid line detachment, four of monitoring device detachment, and three of fluid or device, while a total of two complications occurred with the use of the ETAD, including one of fluid line detachment and one of monitoring device detachment, the differences of which were statistically significant (P=0.015). For the six fluid line setting, a total of 12 complications occurred with the use of the conventional method, including five of fluid line detachment, three of monitoring device detachment, and four of fluid or device dropping, while a total of two complications occurred with the use of ETAD, including one of monitoring device detachment and one of fluid or device dropping, and the differences were statistically significant (P=0.040).
Comparison of conventional and ETAD use
The survey convenience score of the conventional method was 4.0 (range, 4.0 to 5.0), while that of ETAD use was 8.0 (range, 7.0 to 9.0), the differences of which were statistically significant (P<0.001).
DISCUSSION
Patients with critical illness are often transported within the hospital with several fluid and monitoring devices attached, may cause complications such as decreased O2 saturation, hypotension, arrhythmia, cardiac arrest, and device detachment. Numerous studies have reported that 6% to 71% of patient transports had complications [3,15,16].
Many studies have been conducted to develop efficient methods for decreasing complications during patient transport. The studies included ensuring sufficient oxygen supply for patients with a respirator, confirming appropriate device and medical staff, sustaining sedation, securing professional medical staff in case of emergency, following the transport protocol accurately, and transporting to an accessible area [17-20]. Based on a previous study concluding that ETAD could decrease the transport time [14], this study examined patient transport for CT scan within the hospital, which comprises the majority of patient transports, to determine whether it could aid the involved medical staff by decreasing transport related complications.
This study showed that the ETAD decreased the time required for in-hospital patient transport to a CT scan. The total time required for in-hospital patient transport for a CT scan using the conventional method was 488.50 seconds (95% CI, 462.75 to 514.75) and 503.50 seconds (95% CI, 489.50 to 526.75), for five and six fluid lines, respectively, while that using the ETAD method was 364.50 seconds (95% CI, 355.00 to 388.75), and 363.50 seconds (95% CI, 331.75 to 377.75), values that decrease as the number of fluid lines increases, and the differences were statistically significant (P<0.001, P<0.001). These results showed a larger decrease in time compared to the previous study on preparation time.
The research conducted by Doring et al. [10] reported that the increased intra-hospital patient transport time increases the occurrence of hematological instability. Thus, decreasing the intra-hospital patient transport time for CT scans by using the ETAD is expected to decrease complications.
The transport time between the ICU and the CT room did not differ statistically significantly between the conventional and ETAD methods. This result implies that the person pushing the gurney does not affect the time; rather, the distance and route affect transport time.
Employment length did not show statistically significant correlation with transport time. This may imply that the ETAD is effective regardless of staff proficiency, but further research is necessary to confirm this hypothesis.
The analysis of profession showed statistically significant differences in transport time with the five fluid line setting using the conventional method. This result may be because nurses who are normally responsible for patient transport, are more highly proficient than those in other professions are. Since the statistically significant difference disappears when the number of fluid lines increased to six, it is reasonable to assume that the larger number of fluid lines causes difficulty organizing lines attached to the patient regardless of proficiency.
The sex-based analysis did not show a significant difference with the use of the conventional method, but when ETAD was used, the transport by male participants significantly decreased compared to that by female participants. This result is likely caused by the fact that five or six fluids must be moved together using the ETAD, which requires significantly more strength than moving one fluid.
In addition to decreasing transport time, the complications considered in this study were confirmed to occur less often when ETAD was used and the participants reported that the ETAD was more convenient that the conventional method. Thus it is expected to ease patient transport and decrease nurse workload.
The limitations of this study are as follows. First, it considered limited number of fluid lines and monitoring devices when the real patient may be attached to more monitoring devices or additional devices. Second, the use of the Resusci Anne, which is lighter than real patients, did not accurately simulate real patients. Patient height and weight are expected to affect transport time, thus further research in the clinical setting is necessary. Third, the study was conducted with a pre-installed ETAD. Although the installation time was disregarded in this study since it compared transport time, it is clear that installing the ETAD in reality requires more time than the conventional method since the lines must be organized in the flexible cable. However, the inconvenience caused by disorganized lines during transport is greater than organizing the fluid line in one flexible cable, and the installation is not part of the transport. Fourth, patient transport is performed by many people in real life; however, only one individual performed the transport in this study. More research is needed to determine the effects of transport by more than two individuals. Finally, only device-related complications were considered in this study, and complications such as hypotension, decreases in O2 saturation, and cardiac arrest were not considered. Future studies are warranted to overcome these limitations.
Notes
No potential conflict of interest relevant to this article was reported.
Acknowledgements
We would like to thank to Seung Woo Yoo for his assistance.
References
Article information Continued
Notes
Capsule Summary
What is already known
Critically ill patients require many devices. Depending on the transportation time of these patients, these devices can cause numerous complications. It is expected that the patient’s risk would be reduced by reducing the transportation time of the patients.
What is new in the current study
We have developed a device (Easy Tube Arrange Device) to transfer a patient with many fluid lines in a short time. This device was used to compare the transportation time for a CT scan of a mannequin, and the time was shortened.