Electrocardiogram and cardiac testing among patients in the emergency department with seizure versus syncope
Article information

Abstract
Objective
Cardiogenic syncope can present as a seizure. The distinction between seizure disorder and cardiogenic syncope can only be made if one considers the diagnosis. Our main objective was to identify whether patients presenting with a chief complaint (reason for visit) as seizure or syncope received an electrocardiogram in the emergency department across all age groups.
Methods
We conducted a secondary analysis of data collected in the 2010 to 2014 National Hospital Ambulatory Medical Care Survey comparing patients presenting with a chief complaint of syncope versus seizure to determine likelihood of getting an evaluation for possible life threatening cardiovascular disease. The primary endpoint was receiving an electrocardiogram in the emergency department; secondary endpoint was receiving cardiac biomarkers.
Results
There was a total of 144,094 patient encounters. Of these visits, 1,553 had syncope and 1,470 had seizure (60.3% vs. 44.2% female, 19.9% vs. 29.0% non-white). After adjusting for age, sex, mode of arrival and insurance, patients with syncope were more likely to receive an electrocardiogram compared to patients with seizure (odds ratio, 10.86; 95% confidence interval [CI], 8.52 to 13.84). This was true across all age groups (0 to 18 years, 56% vs. 7.5%; 18 to 44 years, 60% vs. 27%; 45 to 64 years, 82% vs. 41%; ≥65 years, 85% vs. 68%; P<0.01 for all). Car- diac biomarkers were also obtained more frequently in adult patients with syncope patients (18 to 44 years, 17.5% vs. 10.5%; 45 to 64 years, 33.8% vs. 21.4%; ≥65 years, 47.1% vs. 32.3%; P<0.01 for all).
Conclusion
Patients evaluated in the emergency department for syncope received an electrocar- diogram and cardiac biomarkers more frequently than those that had seizure.
INTRODUCTION
Patients presenting with syncope and seizures represent about 4 percent of all emergency department (ED) visits, amounting to over 2 million visits per year [1]. Clinical features of syncope and seizures often overlap and it is difficult to distinguish the two [2]. Seizures have up to a 30 percent misdiagnosis rate, the most common being syncope [3]. Recent studies using an implantable loop recorder report up to 20% to 30% of patients with seizures actually have occult cardiovascular causes [4]. Schott et al. [5] revealed a cardiac cause in 20 percent of patients initially diagnosed with epilepsy.
An over-diagnosis of seizure disorder can have significant impact on patient lifestyle, resulting in inappropriate medication use and driving restrictions. More concerning is that patients with cardiac syncope can present with an apparent seizure [2], secondary to hypoperfusion. Failure to identify cardiac syncope due to a potentially lethal dysrhythmia would represent a missed opportunity to prevent sudden cardiac death [6].
The purpose of this study is to compare patients with an initial complaint of seizure to those with an initial complaint of syncope in the ED using a national sample of visits. We hypothesize that patients presenting with an initial complaint of seizure are less likely to receive an evaluation for cardiac disease than patients presenting with an initial complaint of syncope.
METHODS
Study design and setting
We conducted a secondary analysis of data collected in the 2010 to 2014 National Hospital Ambulatory Medical Care Survey (NHAMCS) comparing patients presenting with an initial complaint (reason for visit) of syncope versus seizure to determine likelihood of getting an evaluation for possible life threatening cardiovascular disease [7], with the primary endpoint being obtaining an electrocardiogram (ECG) in the ED.
The NHAMCS is an annual, national probability sample of ambulatory visits made to non-federal, general, and short-stay hospitals in the US conducted by the Centers for Disease Control and Prevention, National Center for Health Statistics. Although the survey includes visits to selected ambulatory care departments, this analysis focuses solely on the visits to hospital EDs. NHMACS data have been utilized previously [8]. The NHAMCS is approved annually by the ethics review board of the National Hospital Care Survey with waivers of the requirements to obtain informed consent of patients and patient authorization for release of patient medical record data by health care providers.
Data processing, including medical coding of reason for visit, cause of injury, diagnosis, and medications are performed by SRA International, Durham, NC, USA. As part of the quality assurance procedure, a 10% quality control sample of patient record forms is independently keyed and coded. Error rates typically range between 0.3% and 0.9% for various survey items.
Subject selection
For this analysis, we included patients that presented in 2010 through 2014 with one of the five listed reason for visit codes for syncope (1,030.0) versus seizure (1,205.0). Patients were excluded if they had both codes for syncope and seizure on the same visit. Patients were included if they had one of either syncope or seizure or unconsciousness (5,840.0). Patients who left without being seen, left without treatment complete or signed out against medical advice were excluded because the evaluation that would have been done had they stayed could not be determined.
Data collection
From the NHAMCS data collection, we included patient demographic information including: age, race, sex, insurance type, mode of transportation. We included past medical history including significant for congestive heart failure, and diagnostic tests including complete blood counts (CBC), electrolytes, glucose, lactate, d-dimer, ECGs, cardiac monitor, computed tomography (CT) head. Disposition was also recorded as was final diagnosis of syncope International Classification of Diseases (ICD)-9 codes of 780.2, 780.4, and 276.51 and seizure ICD-9 codes of 780. 39, 345.9, 780.31, and 345.4.
Main outcome
The main outcome was obtaining an ECG. This was chosen as the main outcome as it is the best screening test for life threatening dysrhythmias or conditions that may make someone prone to a life-threatening dysrhythmia, such as long QTc or Brugada syndrome, Wolff Parkinson White syndrome, hypertrophic cardiomyopathy, arryhthmogenic right ventricular cardiomyopathy, heart block or widened QRS. The secondary outcome was obtaining cardiac biomarkers.
Statistical analysis
For our primary analysis, we compared test utilization of an ECG in patients with seizures versus syncope listed as one of the five reasons for visit stratified based upon the age groupings of 0 to 17, 18 to 44, 45 to 64, and ≥65 years. We chose these groupings because the likelihood of identifying cardiovascular and neurological disease is not uniform throughout life, and etiology of seizures and syncope differ in different age groups. We chose the age cut off of 45 as patients under the age of 45 are at risk of sudden cardiac death due to arryhthmogenic causes that may lie quiescent, first presenting as ‘seizure type’ spells. While the predominant cause of sudden cardiac death in patients older than 45 is coronary artery disease, the predominant cause of sudden cardiac death in those younger than 45 is hypertrophic cardiomyopathy, followed by myocarditis, and then inherited arryhthmogenic syndromes such as long QT syndrome and Brugada syndrome [9].
We performed a similar secondary analysis with cardiac biomarkers as the outcome. We also compared initial complaint to final diagnosis to determine whether syncope or seizure was more or less likely to change during the ED evaluation.
To determine whether seizure versus syncope patients differed by baseline characteristics and outcomes, Student’s t-test and Fisher exact test were used for continuous and categorical data, respectively. To adjust for possible confounders when examining the two groups with regard to final outcome, a forced entry logistic regression model was used within each age group including the following factors: sex, race, past medical history, arrival by ambulance and insurance. Odds ratios with 95% confidence intervals (CIs) were calculated for each outcome.
RESULTS
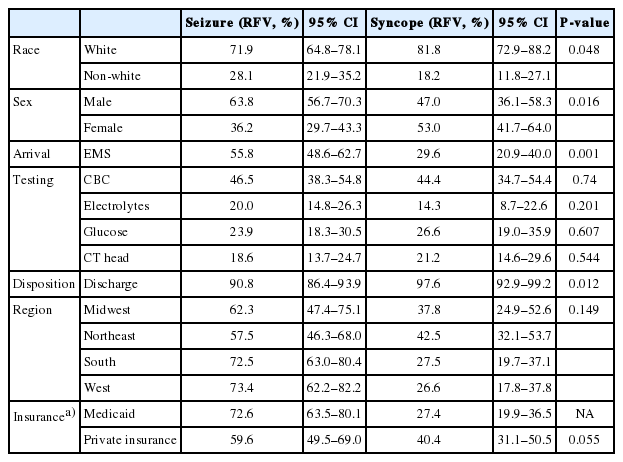
There was a total of 144,094 patient encounters during the study period, representing an estimated 668.8 million survey-weighted visits. Of these visits, 1,553 (7,279,728 survey-weighted visits) had syncope as reason for visit and 1,470 (6,554,859 survey-weighted visits) had seizure as one reason for visit. From this overall sample, 275 visits were excluded due to left without being seen, left against medical advice, or being listed with both syncope and seizure as reasons for visit, leaving 2,861 visits (13,145,659 survey-weighted visits) as the study cohort. Overall baseline demographics are shown in Table 1.

Overall comparison of patients presenting with seizure versus syncope
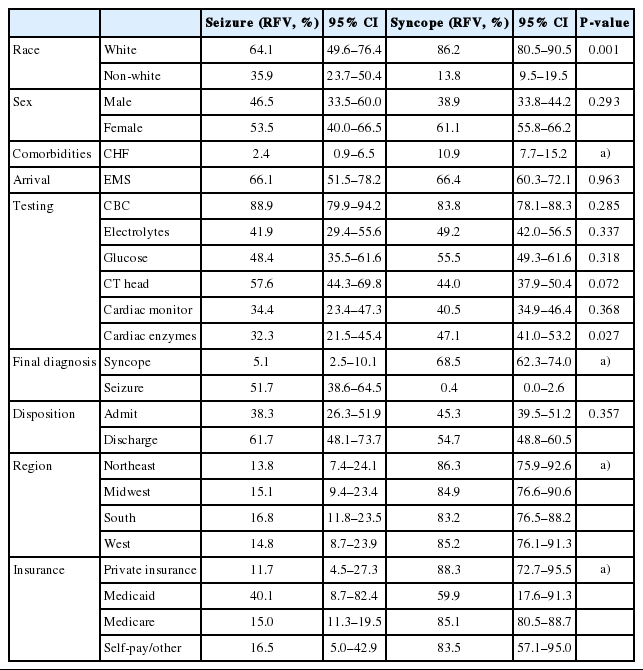
The age cohorts (0 to 17, 18 to 44, 45 to 64, and ≥65 years) were analyzed separately (Tables 2-5). Across all age groups, patients with syncope were more likely to receive an ECG (Table 6), but the difference decreased with age. After adjusting for age, sex, mode of arrival and insurance, patients with syncope were more likely to receive an ECG compared to patients with seizure (odds ratio, 10.86; 95% CI, 8.52 to 13.84). Patients who were older, non-white, arrived by emergency medical service, and had Medicare or private insurance were also more likely to get ECG (Table 7).
Comparison of patients presenting with seizure versus syncope, age 0 to 17 years

Comparison of patients presenting with seizure versus syncope, age 18 to 44 years

Comparison of patients presenting with seizure versus syncope, age 45 to 64 years
Comparison of patients with syncope versus seizure, age greater than 65 years

Primary endpoint of obtaining an electrocardiogram in seizure versus syncope

Primary endpoint of obtaining an electrocardiogram in total sample
In all age groups, patients presenting with seizure versus syncope were more likely to get a CBC (63.1% vs. 73.1%) but not more likely to get electrolytes (29.9% vs. 35.1%), or head CT (35.6% vs. 34.5%). Patients with syncope were more likely to get cardiac biomarkers (29.2% vs. 12.3%) compared to patients presenting with seizure (Table 1).
In the pediatric age group (<18), over 90% of visits resulted in a discharge. In adults, 40% were admitted. Arrival by emergency medical service had an increased likelihood of getting an ECG (Table 7).
The presenting chief complaint and final diagnosis were less likely to be the same in patients presenting with seizure than syncope, 51.7% (95% CI, 38.6 to 64.5) vs. 68.5% (95% CI, 62.3 to 74.0).
DISCUSSION
Results from this study suggest that patients with an initial complaint of syncope are more likely to get an ECG during their ED visit than patients with an initial complaint of seizure; this is true in all age groups. Distinguishing between syncope and seizure can be challenging to bystanders and providers, but is paramount to ensuring a proper work up and treatment. The distinction between syncope and seizures is often unclear to bystanders. Historical features of seizure include prior seizure disorder, tongue biting and incontinence. However, patients that have cardiac syncope are often mistaken by witnesses as having seizure like activity. The fact that NHAMCS does not have specific clinical characteristics often used to distinguish between these two events is a limitation; however, these characteristics were likely taken into account in assigning a final diagnosis [6].
In this cohort, up to 55% of patients that arrived with an initial complaint of seizure had an alternative final diagnosis. This is consistent with prior studies emphasizing the misdiagnosis of seizure [6]. As bystanders are often inaccurate in characterizing the event, providers cannot anchor on the presenting complaint, and may need to evaluate presumed seizures as a possible arryhthmogenic syncopal event. It is notable that the arrival by ambulance, irrespective of reason for visit increases that likelihood of a patient receiving an ECG.
Our study demonstrated that the work up for both seizure and syncope often included laboratory studies and a head CT; the only difference between the groups was in obtaining CBC (seizure group) and cardiac enzymes (syncope group). This points out that much of the evaluation for an undifferentiated spell (either syncope or seizure) focused on low yield testing unlikely to impact detection of life threatening events [10]. However, patients with an initial complaint of syncope were 10.86 times more likely to get an ECG than patients presenting with an initial complaint of seizure across all age ranges.
Quinn et al. [11] reported predictors of death after ED visit for syncope. Patients with an identified cardiac cause had twice the rate of death compared to those without syncope and those with a neurologic cause had 50% greater risk of death. The Framingham study identified that patients with a vasovagal cause of syncope had a good prognosis whereas those with a cardiac cause of syncope had a 10% mortality at 6 months [12]. Thus, missing the diagnosis of syncope and calling it a seizure can have significant downstream effects. The ECG is a simple, non-invasive test that has been widely accepted as part of the standard of care evaluation in patients presenting to the ED with syncope, and should be strongly considered in patients with seizures [13-15].
The greatest risk lies in the missed arryhthmogenic cause of seizure [6] because patients with ventricular tachycardia, who could easily receive appropriate anti-arrhythmic therapy or implantable cardio-defibrillator are instead given anti-epileptics [16]. Patients with symptomatic bradycardia may miss the opportunity to get a pacemaker [17]. Inappropriate use of anti-epileptics can have deleterious cardiovascular effects, such as carbamazepine induced AV block or oxycarbezine induced refractory ventricular fibrillation [18,19].
The limitations of the study are the limitations of using NHAMCS as a database. The database is visit based and not population based. Therefore, incidence of seizure and syncope cannot be appropriately estimated. In addition, the database does not provide longitudinal data as to patient outcomes and whether these diagnoses led to future evaluations. However, the goal of this paper is to show the initial bias in evaluations of these two potentially overlapping conditions. Another limitation is that the final diagnosis is based on abstraction from the chart. While NHAMCS does not specify how this was obtained, it represents a ‘real world’ medicine representation of the treating providers diagnosis, after evaluation and testing is performed. This is different than the reason for visit, which is listed and abstracted from the chart as the ‘chief complaint.’ The change in reason for visit to final diagnosis is a reflection of what often occurs after initial evaluation.
In conclusion, patients evaluated in the ED for syncope received an ECG and cardiac biomarkers more frequently than those that had seizure. Patients presenting with seizure had a different final diagnosis approximately half the time, suggesting the need to do further testing to determine etiology of the event.
Notes
No potential conflict of interest relevant to this article was reported.
References
Article information Continued
Notes
Capsule Summary
What is already known
Patients who present with seizure and syncope often overlap and seizure may be the first presentation of a malignant arrhythmia syndrome.
What is new in the current study
Patients presenting to the Emergency Department with seizure do not get an electrocardiogram or cardiac biomarkers as frequently as patients who present with syncope.