Comparative and retrospective evaluation of the predictive performance of optic nerve sheath thickness and optic nerve sheath diameter for traumatic brain injury using facial computed tomography
Article information

Abstract
Objective
To evaluate the predictive performance of optic nerve sheath thickness (ONST) on the outcomes of traumatic brain injury (TBI) and to compare the inter-observer agreement To evaluate the predictive performance of optic nerve sheath thickness (ONST) for traumatic brain injury (TBI) and to compare the predictive performance and inter-observer agreement between ONST and optic nerve sheath diameter (ONSD) on facial computed tomography (CT).
Methods
We retrospectively enrolled patients with a history of facial trauma and who underwent both facial CT and brain CT. Two reviewers independently measured ONST and ONSD of each patient using facial CT images. Final brain CT with clinical outcome was used as the reference standard for TBI. Multivariate logistic regression analyses, receiver operating characteristic (ROC) curves, and intraclass correlation coefficients were used for statistical analyses.
Results
Both ONST (P=0.002) and ONSD (P=0.001) on facial CT were significantly independent factors to distinguish between TBI and healthy brains; an increase in ONST and ONSD values corresponded with an increase in the risk of TBI by 8.9- and 7.6-fold, respectively. The predictive performances of the ONST (sensitivity, 96.2%; specificity, 94.3%; area under the ROC curve, 0.968) and ONSD (sensitivity, 92.6%; specificity, 90.2%; area under the ROC curve, 0.955) were excellent and exhibited similar sensitivity, specificity, and area under the curve (P=0.18–0.99). Interobserver and intraobserver intraclass correlation coefficients for ONST were significantly higher than those for ONSD (all P<0.001).
Conclusion
ONST on facial CT is a feasible predictor of TBI and demonstrates similar performance and superior observer agreement than ONSD. We recommend using ONST measurements to assess the need for additional brain CT scans in TBI-suspected cases.
INTRODUCTION
Traumatic brain injury (TBI) is a common condition, resulting in approximately 1 million emergency department (ED) visits in the United States and has a mortality rate of 18.4 per 100,000 [1-3]. Facial injury is a frequent, concomitant injury among TBI patients and shares a large number of underlying, trauma-related mechanisms [4]. Several reports have indicated that facial injuries, including facial fractures, are highly associated with TBI [5,6]. Given this association, previous reports have also concluded that both brain and facial computed tomography (CT) scans are recommended for patients with facial injuries [7,8].
Although patients suspected of TBI need a brain CT, indiscriminately and habitually prescribing both facial and brain CT scans for all trauma patients has several disadvantages, as it exposes patients to increasing amounts of radiation, consumes a clinician’s time, and generates higher medical costs [9,10]. Consequently, a more objective measure that could be used prior to ordering a CT scan to exclude TBI in facial injury patients would be imperative. Optic nerve sheath diameter (ONSD) measurement on CT or ultrasound, which reflects elevated intracranial pressure (ICP) in TBI patients [11-14], may serve as such a measure. ONSD on facial CT has recently been demonstrated to be a feasible and reliable diagnostic parameter for TBIs [15].
In practice, measurements of ONSD, alternatively known as the maximum transverse diameter of the optic nerve sheath in the axial plane, in axial CT images of the facial CT may differ between physicians due to differences in interpretation and the difficulty in finding the optic nerve sheath in the images. However, because the optic nerve and optic nerve sheath are cylindrical structures, we hypothesized here that optic nerve sheath thickness (ONST), alternatively known as the maximum height of the optic nerve sheath in the sagittal plane, on sagittal CT images of the face may also reflect elevated ICP. Additionally, we hypothesized that inter-observer agreement on ONST in sagittal CT images of the face may be superior to that of axial images.
To the best of our knowledge, no previous reports of ONST on sagittal facial CT images have been used to predict TBI. Comparative and predictive performance, or inter-observer agreement studies of ONST and ONSD on facial CT also do not exist. Therefore, the primary aim of the present study was to evaluate the predictive performance of ONST for TBI. Our second aim was to compare the predictive performance and inter-observer agreement between ONST and ONSD on facial CT.
METHODS
Study design
The present study utilized a single-center, retrospective design wherein we assessed the electronic medical records (EMRs) of patients who presented in the ED demonstrating both head and facial injury and who underwent facial CT and brain CT simultaneously. The study was approved by the relevant institutional review board of Sanggye Paik Hospital (SGPAIK 2018-10-003), which waived any requirement for written informed consent due to the study’s retrospective nature.
Study setting and population
This study included patients who visited a tertiary university teaching hospital from January 2018 through September 2018. Participant study inclusion criteria were 1) an age of 18 years or older and a history of a prior ED visit for head and facial injuries and 2) facial CT and brain CT performed simultaneously in the ED with results available via EMR. Participant study exclusion criteria were 1) preexisting ophthalmologic disease, such as glaucoma, that could influence ONSD or ONST results; 2) ongoing or a history of non-traumatic facial and/or brain pathology, such as stroke or brain tumor; 3) history of brain or facial surgery; or 4) incomplete EMR data (Fig. 1).
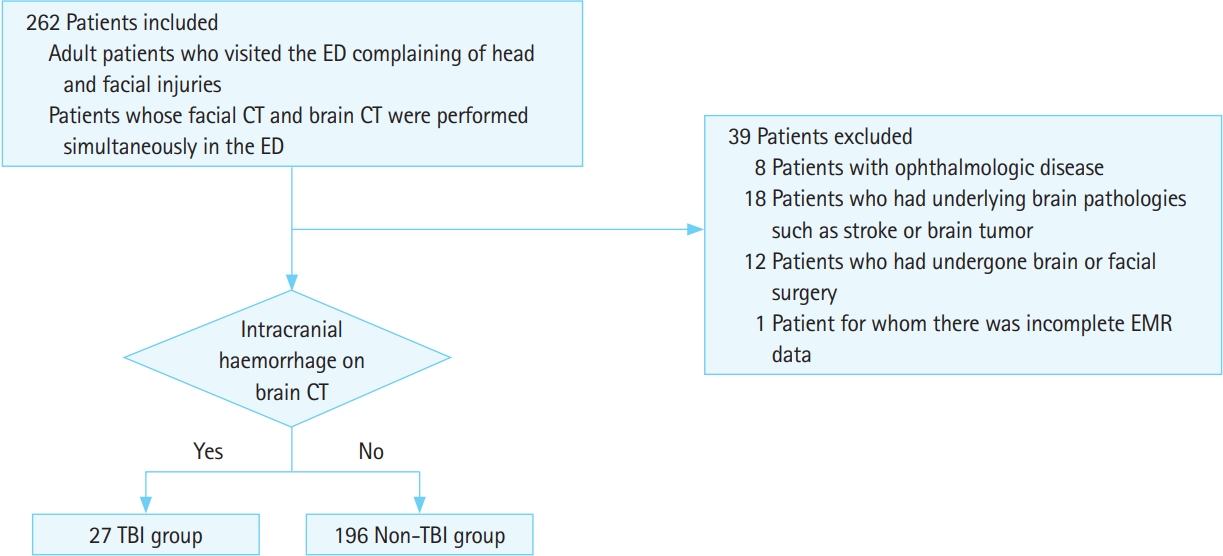
Flowchart of patient selection. ED, emergency department; CT, computed tomography; EMR, electronic medical record; TBI, traumatic brain injury.
Study protocol
One emergency physician (EP) collected data from all eligible patients’ EMRs, which were stored in a picture archiving and communication system (PACS) (Maroview 5.4, Infinitt, Seoul, Korea). The data included patient’s sex, age, and Glasgow coma scale (eye opening response, verbal response, and motor response) recorded at the time of the ED visit; clinical symptoms and signs such as vomiting, seizures, and loss of consciousness; presence of intracranial hemorrhage and/or facial fractures; skull fractures and their locations.
Image acquisition and ONST measurement
Both facial and brain CT examinations were performed using a 320-slice multidetector CT scanner (Aquilion ONE Dynamic Volume CT, Toshiba Medical Systems Corporation, Otawara, Japan). Facial CT scans were reconstructed three-dimensionally (axial, sagittal, and coronal dimensions) with a series of 3-mm-thick slices parallel to the hard palate and reaching the superior border of the orbit.
All images were retrospectively and independently evaluated by two board-certified EPs who were not involved in patient selection and who were blinded to patients’ final diagnoses and outcomes. ONST was measured at a distance of 3 mm, posterior to the eyeball, immediately below the sclera of the patients’ left and right eyes using sagittal planes from the reconstructed sagittal plane facial CT images obtained through PACS in stack mode (Fig. 2A). ONSD was measured in the same manner but using axial plane facial CT images, also in stack mode (Fig. 2B). ONST and ONSD were measured twice by each reviewer. Window parameters included the following: window width, 60; window length, 360; and accuracy, 1 pixel with 200% enlarged plane. All measurements were made using the same window, contrast, and brightness.
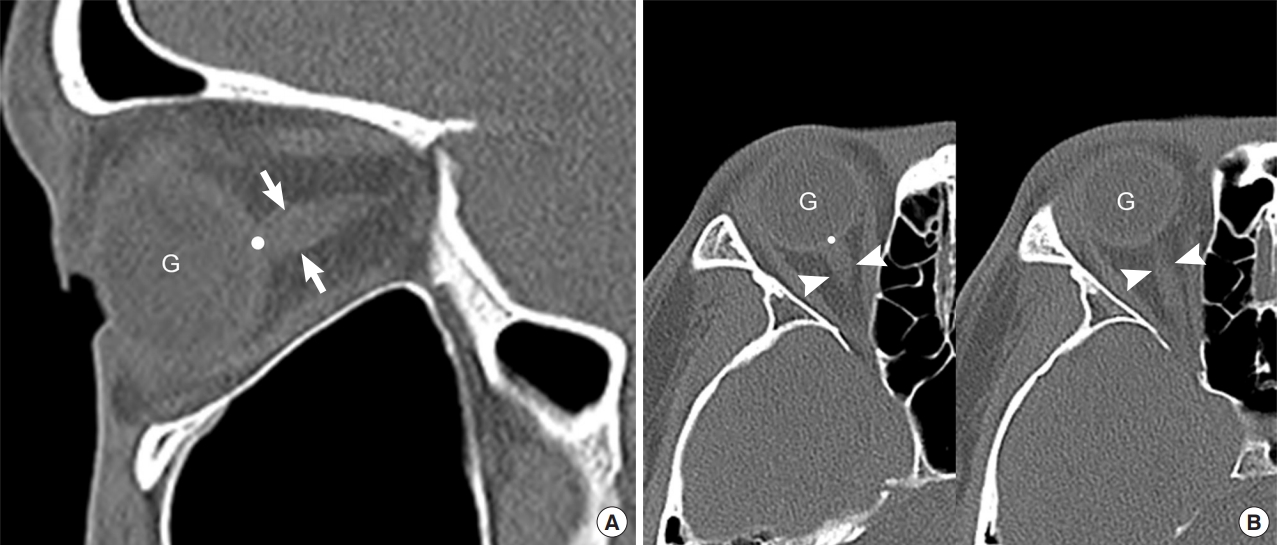
Use of sagittal (A) and axial (B) noncontrast facial computed tomography images to measure the optic nerve sheath thickness (ONST) and optic nerve sheath diameter (ONSD). (A) ONST (arrows) is defined as the thickness of the optic nerve sheath 3 mm posterior to the globe (point). ONST can be evaluated on single sagittal image. (B) ONSD (arrowheads, left and right) was defined as the transverse diameter of the optic nerve sheath 3 mm posterior to the globe (point). ONSD cannot be evaluated on a single axial image owing to partial volume artifact. G, globe.
TBI analyses and reference standards for differentiating TBI from non-TBI
Traditionally, TBI is defined with three components, which includes its mechanism (closed vs. penetrating), clinical severity GCS (Glasgow coma scale), and structural damage. Although it is important to evaluate each of the three components, the participant’s level of consciousness following medical sedation, alcohol, or drug intoxication may complicate the final diagnosis. Therefore, there is a need for objective decision modalities, such as neuroimaging (brain CT). Here, we defined TBI as positive brain CT results (TBI), which includes the presence of intracranial hemorrhage on brain CT. Alternatively, a negative CT result (non-TBI) included the absence of intracranial hemorrhage on brain CT without any development of new symptoms.
Reference standards, to differentiate between TBI and non-TBI, were constructed from brain CT results with clinical progress notes after a period of at least one month. The reference standards were determined by one senior board-certified EP and one board-certified radiologist who were not involved in patient selection and image analysis. They confirmed presence or absence of an abnormal high-attenuated lesion in the brain by consensus.
Data analyses
Pearson’s correlations were used to evaluate the correlation coefficients (r) between ONST and ONSD. A P-value below 0.20 indicated no correlation, 0.21–0.40 indicated a weak correlation, 0.41–0.60 indicated a moderate correlation, 0.61–0.80 indicated a high correlation, and 0.81 or more indicated a very high correlation. The mean differences for measured ONST values were also plotted against measured ONSD values using the Bland-Altman plot. Multivariate logistic regression analyses were applied to determine which of the independent facial CT factors were relevant to the differential diagnosis of a positive CT scan using data from reviewer 1 (the more senior EP). Multivariate logistic regression analyses were conducted on those variables which were found to be statistically significant according to the univariate analyses. Adjusted odds ratios (ORs) and 95% confidence intervals (CIs) were generated from multivariate analyses. A receiver operating characteristic curve analysis, which includes the cut-off values for optimal area under the curve (AUC), sensitivity, and specificity, was performed to evaluate the predictive performance of ONST and ONSD via facial CT for TBI. An optimal cut-off value was defined as the point at which the value of “sensitivity+specificity-1” was at a maximum (Youden’s index). Furthermore, intraclass correlation coefficients (ICCs) with 95% CIs were calculated to determine interobserver and intraobserver agreement levels. ICCs of 0–0.20 indicated poor agreement, 0.21–0.40 indicated fair agreement, 0.41–0.60 indicated moderate agreement, 0.61–0.80 indicted good agreement, and 0.81–1.00 indicated excellent agreement. DeLong’s test was applied to compare the predictive performance and ICCs between ONST and ONSD. All statistical analyses were performed using MedCalc ver. 12.3.0 (MedCalc Software, Mariakerke, Belgium). A P-value <0.05 was considered statistically significant.
RESULTS
Baseline characteristics
A total of 223 patients were included in the present study and their baseline characteristics are presented in Table 1. The mean patient age was 52.9 (range, 18 to 87 years) and 63.7% of patients were men. Intracranial hemorrhage was diagnosed in 27 patients (12.1%) according to the reference standard. The mean time from the onset of symptom was 2.7 days (range, 0 to 14 days). The mean interval between patients’ ED visit and CT was 1.1 hours (range, 0 to 3 hours) and the mean interval between facial CT and brain CT was 3.5 hours (range, 0 to 7 hours).
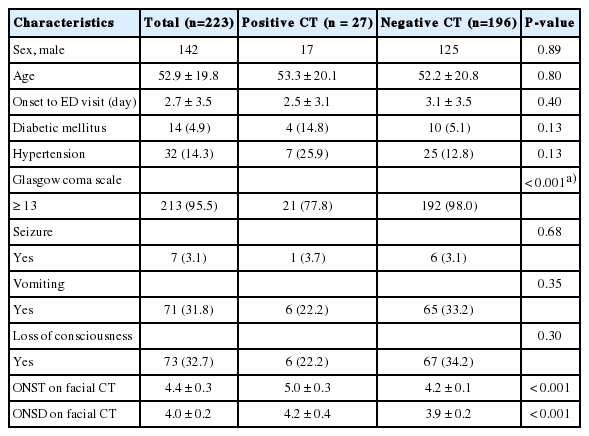
Patient demographic characteristics and results of univariate analysis
Correlations between ONST and ONSD
According to reviewer 1, the mean ONST and ONSD values on facial CT were 4.4±0.3 and 4.0±0.2 mm, respectively (Fig. 3A). According to reviewer 2, the mean ONST and ONSD values on facial CT were 4.3±0.2 and 3.9±0.2 mm, respectively (Fig. 3B). Correlation analyses between their paired measurements (e.g., ONST for reviewer 1 vs. ONSD for reviewer 1) revealed a strong correlation (reviewer 1, r=0.865; reviewer 2, r=0.899) (Fig. 3A, B). Crosslinked comparisons (e.g., between ONST for reviewer 1 vs. ONSD for reviewer 2) also revealed strong correlations (r=0.843–0.880) (Fig. 3C, D).
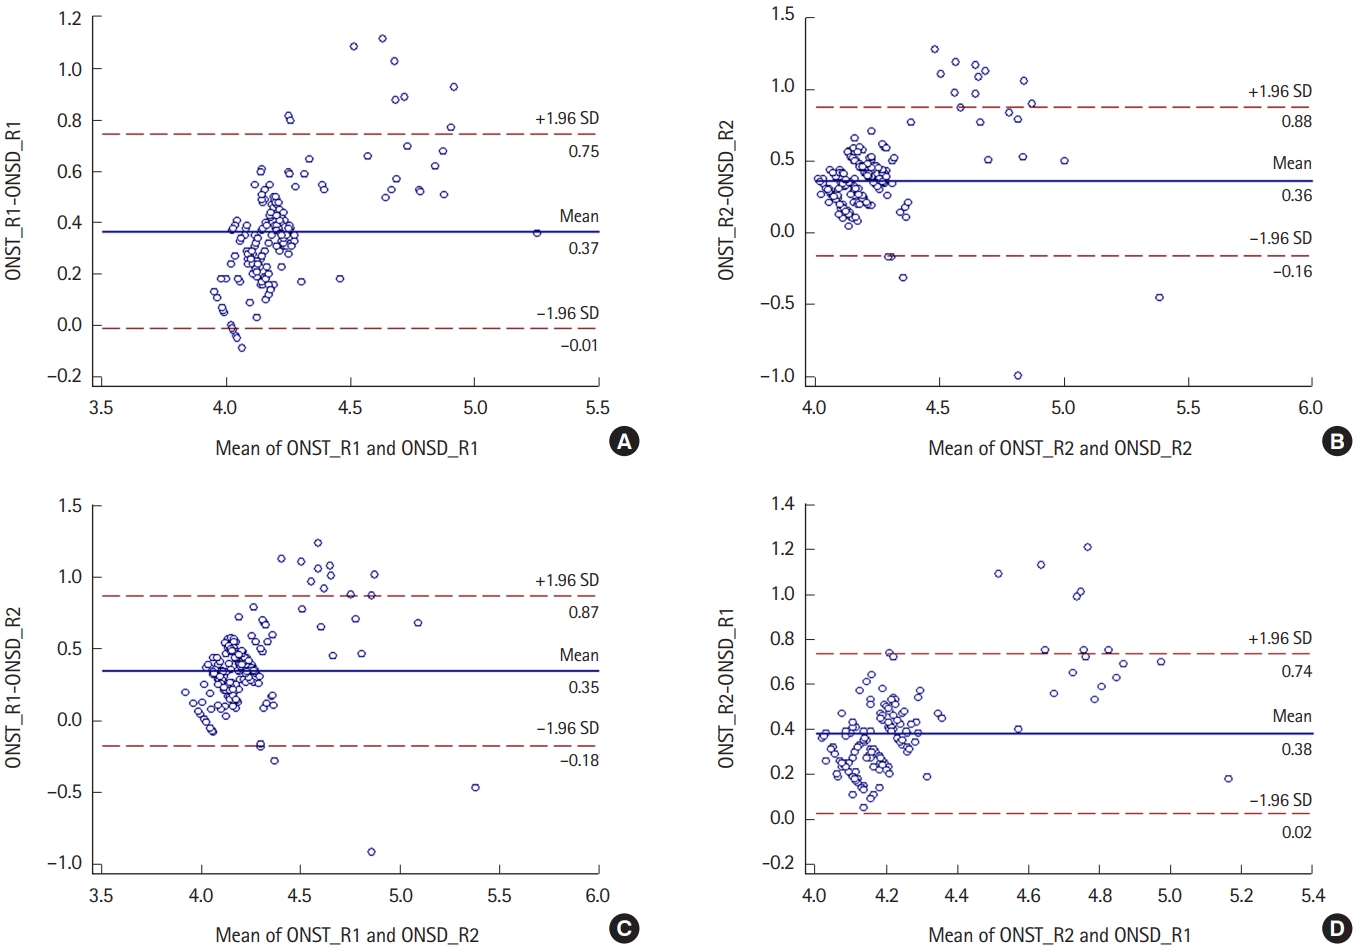
Bland-Altman plots show the mean differences between optic nerve sheath thickness (ONST) and optic nerve sheath diameter (ONSD). All BlandAltman plots show a direct proportional relationship between ONST and ONSD and similar mean differences between ONST and ONSD (approximately 0.4). (A) Relationship between ONST for reviewer 1 (ONST_R1) and ONSD for reviewer 1 (ONSD_R1). (B) Relationship between ONST for reviewer 2 (ONST_ R2) and ONSD for reviewer 2 (ONSD_R2). (C) Relationship between ONST_R1 and ONSD_R2. (D) Relationship between ONST_R2 and ONSD_R1. SD, standard deviation.
Factors influencing positive or negative brain CT scan diagnoses
Among the clinical variables assessed here, the Glasgow coma scale score most significantly discriminated between the positive and negative brain CT scan groups (P<0.001). Facial-CT results of both ONST and ONSD also significantly differed between the two groups (P<0.001 for both). ONST and ONSD on facial CT were significantly higher for the positive brain CT scan group than for the negative brain CT scan group (Table 2).

Multivariate analysis of variables discriminating between positive CT scans and negative CT scans
Multivariate logistic regression analyses revealed that ONST (P=0.002) and ONSD (P=0.001) on facial CT were significant, independent factors for discriminating between the positive and negative brain CT scan groups. Increase in the value of ONST and ONSD on facial CT, correlated with an increase in the risk for TBI by 6.8-fold and 6.3-fold, respectively (Table 2). However, Glasgow coma scale scores were not significantly related to these incidences.
Predictive performance of ONST and ONSD for TBI
At the ONST cut-off value of 4.5 mm, the AUC was highest (0.968), with 96.2% sensitivity and 94.3% specificity (Table 3). Furthermore, AUC was also the highest (0.955) at the ONSD cut-off value of 4.1 mm, with 92.6% sensitivity and 90.2% specificity.

Predictive values of independent factors for discriminating between positive CT scans and negative CT scans
With regards to the predictive performances of the ONST and ONSD, the sensitivity, specificity, and AUC of ONST were comparatively higher than those of ONSD; however, these differences were not significant (sensitivity, P=0.99; specificity, P=0.18; AUC, P=0.73).
Interobserver and intraobserver agreements
The interobserver (between reviewers 1 and 2) and intraobserver agreements (between first and second measurements for each reviewer) for ONST on facial CT were excellent (ICC range, 0.932 to 0.956). The interobserver and intraobserver agreements for ONSD on facial CT were good to excellent (ICC range, 0.782 to 0.827). A comparison of interobserver and intraobserver ICCs between ONST and ONSD on facial CT, showed that ICCs for ONST were significantly higher than for those for ONSD (all P<0.001).
DISCUSSION
Here, we demonstrated that both ONST on sagittal facial CT images and ONSD on axial facial CT images are feasible screening tools for the prediction of TBI in both facial and head injury patients. Additionally, the predictive performances of ONST and ONSD were excellent and showed similar sensitivities, specificities, and AUCs. However, levels of interobserver and intraobserver agreement for ONST were significantly higher than those for ONSD. Based on these results, we contend that ONST via sagittal facial CT images might be readily used as a CT-based screening tool for determining patient candidacy for further brain CT scans.
The optic nerve connects the eyeball to the cranium directly, running posterior-centrally and dorsally, towards the optic chiasm. It is surrounded by the optic nerve sheath, which is filled with cerebro spinal fluid (CSF) and directly communicates with the subarachnoid space, thus demonstrating elevation of the ICP due to increased pressure enlarging the ONSD [16-18]. Considering this anatomy, images of the optic nerve sheath were obtained obliquely rather than horizontally, in facial CTs performed parallel to the hard palate and reaching the superior border of the orbit. However, this may not allow us to visualize the entire optic nerve sheath (Fig. 2B). Moreover, it may be difficult to distinguish the ocular muscles and ophthalmic artery from the optic nerve for EPs if they are not fully visualized [19]. However, sagittal images are reconstructed at a right angle to axial images, which often indicates that the optic nerve sheath clearly also includes the optic nerve.
Previously, an enlarged ONSD on brain CT was taken as an independent, predictive factor for mortality, poor prognosis, and the severity of a TBI [20,21]. However, interrater variance between EPs depends on their experience in measuring ONSDs using ultrasound [22-24]. In one report, the ICCs between emergency medicine residents and fellowship-trained EPs were 0.5 and 0.73, respectively, indicating experience-dependent improvements in reliability. Furthermore, the ICC of all EPs was found to be 0.54. In the present study, although we didn’t evaluate the ICC of emergency medicine residents, the ICC of ONST on facial CT was found to be over 0.9, which is remarkably high [19]. Additionally, we previously demonstrated that the ONSD on facial CT had a feasible predictive performance in identifying TBI [15]. Here, we found no difference between ONSD and ONST on facial CT. Furthermore, the ICC between both EPs was large and statistically significant.
Physical and neurological examinations have limited scope to differentiate between facial bone fractures and TBI; however, this does not mean that all facial trauma patients need additional brain CT to exclude brain pathology from the final diagnosis. Additional radiologic evaluations, such as brain CT, may be required in patients with suspected TBI to fully and objectively evaluate their facial and head injuries [25,26]. However, in patients without suspected TBI, additional radiologic evaluation may not be required, because of the risk of increased radiation exposure, especially among vulnerable patients such as children and pregnant women, followed by an increase in medical costs [27,28]. Although the Canadian head CT rule and the New Orleans Criteria offer some guidelines, they primarily rely on additional methods to support the evaluation of TBIs [29-31]. Hence, when a patient presents with facial trauma, which is common among TBI patients, measuring both ONSD and ONST may prove necessary to help clinicians decide whether to request additional brain CTs. Based on the results of the present study, we recommend that ONST on sagittal facial CT images be assessed prior to prescribing any additional brain CT, especially when novice EPs are involved in the patient’s care.
To the best of our knowledge, no previous studies have used ONST of facial CT to screen for TBI. Furthermore, the additional medical costs associated with multiple CT scans represents another area of concern among EPs. Although neurological symptoms such as an altered mental state, vomiting, and amnesia may be present in these cases, brain hemorrhage, which is vital to understanding the patient’s condition, may not be observed on a brain CT alone. This study provides some indications in the form of evidence, which can be used to justify ordering a brain CT in TBI cases. This information may assist EPs in deciding the necessity of these additional tests and expenses, and warn them about the possible occurrence of an underlying problem, such as hemorrhage or neurologic complications.
Apart from its significant benefits to the scientific community, the present study also has several limitations. First, it is subject to selection bias because it was conducted at a single center and with a retrospective design. However, we did include a relatively large number of TBI patients (whose ONST and ONSD were measured via CT). Second, we did not evaluate the ICC between EPs with different experience (e.g. residents vs. attending EP) and patient results. Several previous reports have indicated a mean intraobserver variance of 0.1–0.2 mm and a mean interobserver variance of 0.2–0.3 mm [32-34]. Third, we did not evaluate the relationship between ONST and ICP, and between ICP and cases with TBI. ONSD is a well-known non-invasive estimator of ICP [35,36]. Thus, we hypothesized that ONST may have a good correlation with elevated ICP (>20 mmHg). However, the presence of TBI does not necessarily mean that ICP is elevated (especially in mild TBI). Thus, the cut-off value of ONST for prediction of TBI in the present study may not be the same ONST cut-off value for the prediction of elevated ICP. Finally, we did not compare the diameter of the ONST on facial and brain CTs. At our institution, 3D reconstruction is routinely performed for facial CTs but not brain CT, thus, a comparison between sagittal facial and brain CT images was impossible, but future studies might take this approach. Furthermore, although we show that the thickness of the ONST on sagittal images might be useful in predicting TBI, additional measurements might expand the usefulness of facial CT. Since no additional measures were taken in the present study, future studies might consider taking this approach in order to expand on the work presented here. Largescale, prospective, multicenter studies are required to confirm the results presented here before they are generalized or codified as clinical recommendations.
In conclusion, ONST on facial CT is a reliable and helpful predictor of TBI, demonstrating similar performance to and observer agreements superior to ONSD. Therefore, we recommend using ONST measurements to assess whether additional brain CT scans are necessary in TBI-suspected cases.
Notes
No potential conflict of interest relevant to this article was reported.
References
Article information Continued
Notes
Capsule Summary
What is already known
There are several reports that demonstrate measuring optic nerve sheath diameter (ONSD) plays an important role in predicting traumatic brain injury in head trauma patients.
What is new in the current study
In practice, measurements of ONSD in axial computed tomography (CT) images of the facial CT may differ between physicians due to individual interpretation differences and difficulty finding the optic nerve sheath in axial images. In this study, we demonstrated optic nerve sheath thickness on facial CT is a reliable and helpful predictor of traumatic brain injury and demonstrates similar performance to and superior observer agreement than ONSD.