The predictive value of HEART score for acute coronary syndrome and significant coronary artery stenosis
Article information

Abstract
Objective
Rapid determination of acute coronary syndrome (ACS) in the emergency department (ED) is very important for patients presenting with ischemic symptoms. The aim of this study was to determine the predictive value of HEART score for ACS and significant coronary artery stenosis (SCS).
Methods
We retrospectively analyzed data of patients who visited the ED with chest discomfort and were admitted to the cardiology department. Enrolled patients were classified into ACS and non-ACS groups according to their discharge diagnosis. Patients who underwent imaging were further divided into SCS and non-SCS groups according to study results. We compared age, sex, vital signs, risk factors, electrocardiogram, troponin, and HEART score for each group. For ACS and SCS predictive performance, the test characteristics of HEART score was calculated using sensitivity, specificity, predictive value, likelihood ratio, and receiver operating characteristic (ROC) curve analysis.
Results
Of 207 patients, 112 had ACS. Among enrolled patients, 155 underwent imaging workup, of whom 67 had SCS. HEART score ≤3 had 93% sensitivity for ACS and 97% for SCS. HEART score ≥7 had 82% specificity for ACS and 83% for SCS. HEART score area under ROC curve for ACS was 0.706 (95% confidence interval, 0.627–0.776) and 0.737 (95% confidence interval, 0.660–0.804) for SCS.
Conclusion
HEART score was a fair predictor of ACS and SCS in ED patients who presented with chest symptoms and were admitted to the cardiology department. The predictive power of HEART score was better for SCS than for ACS.
INTRODUCTION
Chest pain is one of the most common reasons for visiting the emergency department (ED) [1]. It is important to quickly identify acute coronary syndrome (ACS) in patients who have chest pain in the ED because it can provide a significant benefit to the patient from early treatment [2].
There are several risk stratification score systems for ACS including TIMI (Thrombolysis in Myocardial Infarction), PURSUIT (Receptor Suppression Using Integrilin Therapy), GRACE (Global Registry of Acute Coronary Events), HEART (history, electrocardiography, age, risk factors, troponin) score to name a few. The first three aforementioned scoring systems were designed to identify high-risk patients that could benefit from active reperfusion therapy and determine ACS prognosis [3]. However, it is not known if they are applicable to patients with undifferentiated cardiac symptoms. In contrast, HEART score is a risk stratification scoring system originally developed in an ED setting [1].
The HEART score consists of five components: history, electrocardiogram (ECG), age, risk factors, and troponin. Each of these factors is scored from 0 to 2, with a total HEART score of 0 to 10 (Table 1) [4]. HEART score is an easy, quick, and reliable predictor of major adverse cardiovascular events (all-cause mortality, myocardial infarction, or coronary revascularization within 6 weeks) in patients presenting to the ED with undifferentiated chest pain [5]. This score classifies ED patients with chest pain or discomfort according to the degree of risk for major adverse cardiovascular events. Patients are divided into low-risk (score 0–3), intermediate-risk (score 4–6), and high-risk (score 7–10) groups. Although HEART score is a risk stratification system score for the prognosis of chest pain, some studies identify the predictive value of the HEART score for diagnosing ACS, comparing HEART score with clinical suspicion or other risk scores [6,7]. In fact, there was substantial diagnostic accuracy for ACS in an unselected population of ED patients with chest pain [6]. Knowing the degree of coronary stenosis is clinically important, and high-grade coronary stenosis has been shown to pose several threats during the early post-infarction and hospital discharge phases [8].

Baseline characteristics according to ACS diagnosis and SCS
In this study, we used HEART score as a guideline for safe discharge of low risk patients. Additionally, we evaluated the diagnostic value for ACS using a reference standard of discharge diagnosis in patients with cardiac symptoms who were admitted to the cardiology department via the ED. We also investigated the predictive values of HEART score for significant coronary artery stenosis (SCS), which is clinically related to ischemic symptoms and short-term clinical outcome of myocardial infarction.
METHODS
Study population
This retrospective observational study analyzed medical record data of patients who visited a tertiary ED with an annual average of 35,000 patients from January 1, 2014 to June 30, 2015. We studied patients who were 19 years or older, visited the ED with initial chest pain and/or chest discomfort, and were admitted to the cardiology department via ED during the study period. The patients were hospitalized under the decision of an emergency physician or an internist on duty. We excluded patients who were diagnosed with ST-segment elevation myocardial infarction (STEMI). Based on their discharge diagnosis, patients diagnosed with angina and myocardial infarction were classified in the ACS group and all others were classified as non-ACS. According to coronary image workup (coronary angiography [CAG] or computerized tomography coronary angiogram [CTCA]) results, patients were also classified in the SCS group with 70% or greater coronary artery stenosis and the non-SCS group with less than 70% coronary artery stenosis (Fig. 1). This study was approved by the institutional review board of Soonchunhyang University Seoul Hospital (2017-04-005-003) and the informed consent was waived for minimal risk clinical investigation.

Flow chart of patient selection. ED, emergency department; STEMI, ST-segment elevation myocardial infarction; ECG, electrocardiogram; SCS, significant coronary stenosis; ACS, acute coronary syndrome.
Data collection
We recorded patient age, sex, vital signs, height, weight, medical history (hypertension, diabetes, hyperlipidemia, and previous coronary artery disease), family history of coronary artery disease, and radiologic and laboratory data. The patient’s medical records were based on the initial ED medical records and with lack of data, we referred to the hospital admission record of the cardiology department. The standard of obesity was based on the Korean obesity standard of body mass index (BMI) ≥25 kg/m2 instead of the Western obesity standard of BMI ≥30 kg/m2. ECGs were recorded and troponin T measurements were performed in all patients at presentation. ECGs were conducted immediately after the hospital visit for patients with cardiopulmonary symptoms. We also performed ECG within 30 minutes of their ED visit for patients with non-specific or atypical symptoms such as epigastric pain. Two emergency physicians retrospectively analyzed ECG results for each patient. The analysis of cardiac enzymes were also performed during the initial blood test in all patients. Troponin T levels were measured by Cobas 8000 (Roche Diagnostics, Indianapolis, IN, USA). CAG and CTCA results were also analyzed during hospitalization. Final patient diagnosis was confirmed with hospital discharge records.
Study outcomes and data analysis
The main outcome was the occurrence of ACS and SCS, and HEART score was compared and analyzed for each group. For overall differences in HEART score between groups (ACS vs. non-ACS, SCS vs. non-SCS), HEART score and patient distribution of HEART score were compared. The proportion of patients within each group with a specific score was also compared for all five HEART score components. For analyzing the HEART score diagnostic characteristics for ACS and SCS, the sensitivity, specificity, positive predictive value, and negative predictive value, likelihood ratios (LR−, LR+) of low risk score (score ≤3) and high risk score (score ≥7) were tabulated. Overall predictive performance was evaluated by plotting receiver operating characteristic curves.
For descriptive analysis, means with standard deviation or numbers with percentages were reported. For continuous variables, a Student t-test was performed and chi-squared or Fisher exact tests were used to analyze categorical variables. P<0.05 was considered statistically significant. All analyses were performed using IBM SPSS Statistics ver. 20.0 (IBM Corp., Armonk, NY, USA) and Medcalc ver. 19.0.5 (MedCalc Software, Mariakerke, Belgium).
RESULTS
During the study period, 207 patients were included. Of 207 patients, 155 underwent coronary artery visualizations (CAG and CTCA). The other 62 patients did not undergo CAG for the following reasons: diagnosis other than ACS (dilated cardiomyopathy, hypertrophic cardiomyopathy, pericarditis, non-cardiac problem, etc.), non-specific echocardiography findings, and negative treadmill test results. Of these 155 patients, 67 had SCS, of which 63 had reperfusion therapies for SCS (61 percutaneous coronary interventions and two coronary artery bypass grafts) and four obtained medical treatments. Finally, 112 patients were primarily diagnosed with ACS at discharge (Fig. 1).
Patient characteristics for this study population are outlined in Table 1. Average HEART score was higher in the ACS and SCS groups than in the non-event group. Table 1 also shows the five predefined elements of the HEART score with modified Korean obesity BMI index and occurrence of ACS and SCS. The proportion of patients with each HEART component score and with and without ACS and SCS are presented.
The prevalence of ACS and SCS tended to increase with HEART score (Fig. 2). Patients with a HEART score of 0–1 were all non-ACS, and patients with a HEART score of 9–10 were all in the ACS group. Of the patients who underwent imaging tests, no patients with a 0–2 HEART score had SCS and all patients with a 9–10 HEART score had SCS. Of the patients who underwent imaging tests, less than 30% of patients with a HEART score of ≤5 had SCS, but for scores ≥6, the rates of SCS increased rapidly.
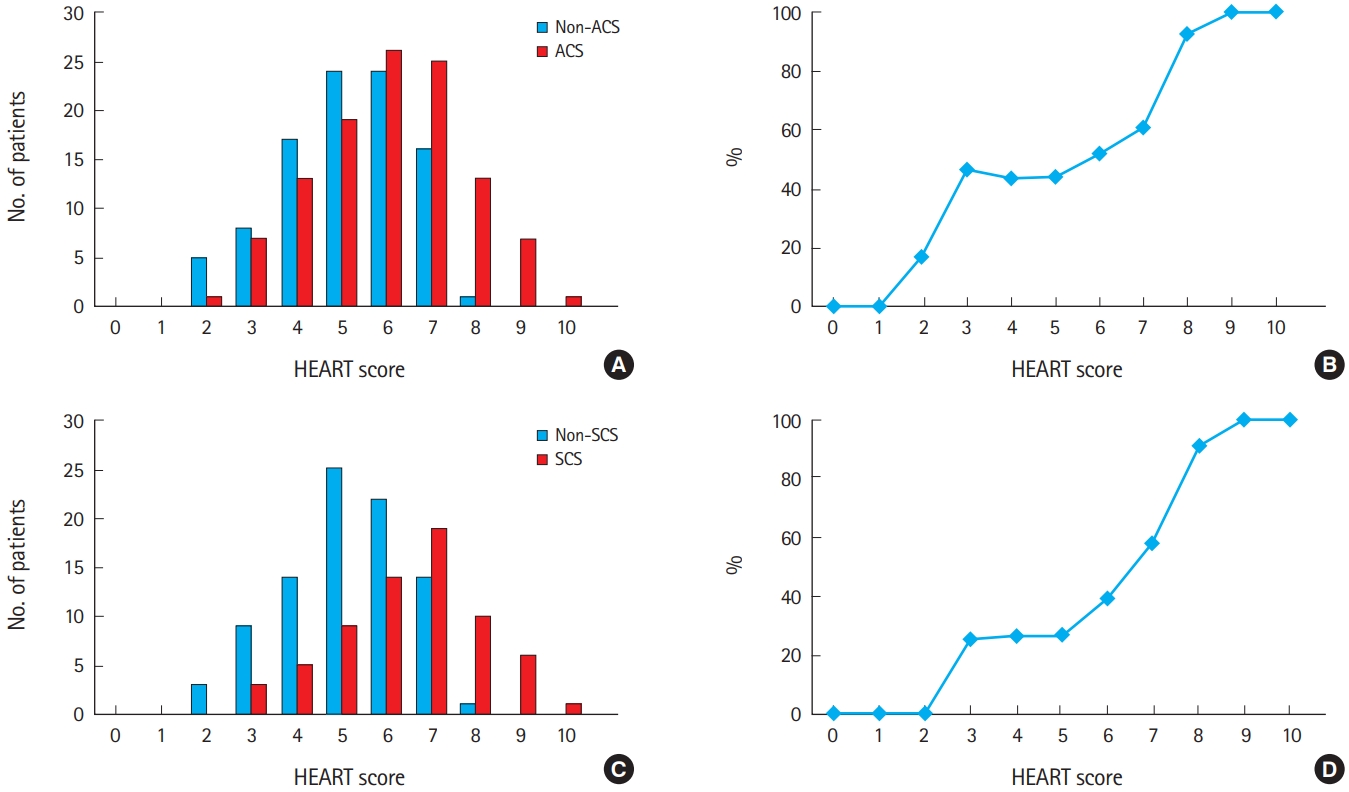
(A) Prevalence and (B) probability of acute coronary syndrome according to HEART score category. (C) Prevalence and (D) probability of significant coronary artery stenosis (SCS) according to HEART score category.
Tables 2 and 3 show the diagnostic characteristics of the HEART score for ACS and SCS including sensitivity, specificity, negative or positive predictive values, and likelihood ratios (LR−, LR+). The sensitivity of HEART score ≤3 was 92.8% (95% confidence interval [CI], 86–97) for a non-ACS diagnosis and 96.8% (95% CI, 93–98) for a non-SCS prediction. Conversely, the specificity of a HEART score ≥7 was 82.1% (95% CI, 73–89) for ACS diagnosis and 83.0% (95% CI, 74–90) for SCS prediction.

Diagnostic characteristics of low risk estimation for non-ACS and non-SCS

Diagnostic characteristics of high risk estimation for ACS and SCS
Overall diagnostic performance of the HEART score was evaluated by plotting receiver operating curves for ACS diagnosis and SCS prediction (Fig. 3). HEART score was plotted as a 10-category parameter. Areas under the curve for ACS diagnosis were 0.706 (95% CI, 0.627–0.776) and 0.737 (95% CI, 0.660–0.804) for SCS prediction. The cut-off values of the HEART score were 6 for ACS diagnosis and 7 for SCS prediction, respectively.
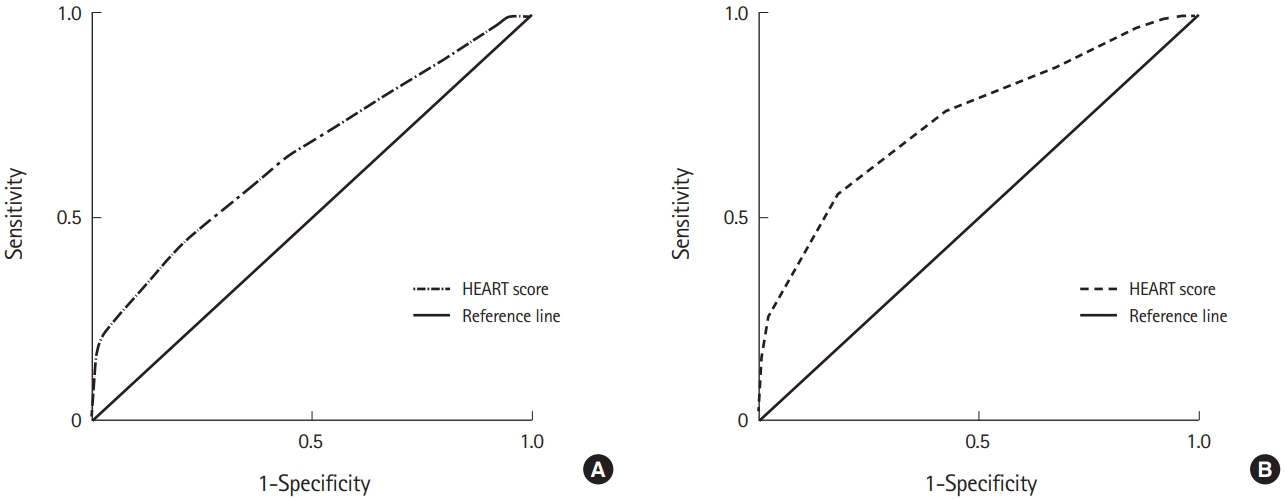
Receiver operating characteristic curves of HEART score for (A) Acute coronary syndrome: area under the curve=0.706 (95% confidence interval, 0.627–0.776; cut-off value, 6 point; sensitivity, 67.71%; specificity, 62.71%). (B) Significant coronary artery stenosis: area under the curve=0.737 (95% confidence interval, 0.660–0.804; cut-off value, 7 point; sensitivity, 99.00%; specificity, 23.58%).
DISCUSSION
In our study, we demonstrated that HEART score is a fair diagnostic predictor of ACS in ED patients with chest pain symptoms. We also investigated the predictive value of the HEART score for SCS, which is clinically related to the prognosis of myocardial infarction with the reference standard of coronary visualization. The predictive power of the HEART score was better for SCS than ACS.
The HEART score is the risk stratification score specifically used for chest pain patients with suspected non-ST elevation–ACS in the ED. This score is also a simple and reliable predictor of outcome in chest pain patients and has been validated widely as a risk stratification tool. However, little information about the diagnostic power of the HEART score for ACS with a reference standard of discharge diagnosis is available. As far as we know, this is the first study to investigate the predictive power of the HEART score for SCS.
Our study included patients who were admitted to the cardiology department based on the clinical decision of a physician. Thus, there was a higher prevalence of ACS (54.1%) and greater proportion of high-risk patients (HEART score 7–10, 30.4%) in this study population than those reported in a previous study (ACS 29.4%; HEART score 7–10, 22.4%) [6]. This fact may have contributed to the observed lower negative predictive value and higher positive predictive values of our results compared to those reported in previous studies [5-7]. In our population, this low negative predictive value of a low HEART score may be of concern for physicians, and further studies are needed. Furthermore, patients who underwent coronary imaging workup were also higher risk patients who required CAG. Among the included patients, 43.2% had SCS. There was a higher proportion of high-risk patients (HEART score 7–10, 32.9%) in the patients with an image workup than in the total overall hospitalized patients. These differences in patient characteristics may have led to the observed lower area under the curve (AUC) than that reported by a previous study (0.706 [0.63–0.78] vs. 0.81 [0.76–0.86]).
Wang et al. [9] reported non-STEMI with coronary occlusion as a STEMI equivalent and advised to consider early percutaneous coronary intervention. Meyer et al. [8] reported that high-grade coronary stenosis posed several threats during the early post-infarction phase, as well as hospital discharge. Therefore, the degree of coronary stenosis is clinically important, but the definitive criterion for SCS is controversial. Kern et al. [10] defined SCS as more than 50% stenosis in the left coronary artery or stenosis of more than 70% in the other coronary arteries. Ischemic symptoms were present when more than 50% stenosis of major blood vessels was accompanied by other significantly narrowed vessels [11]. There are several definitions of SCS, but in many studies, coronary stenosis between 50% and 80% is considered significant [12]. In this study, we defined more than 70% coronary stenosis as SCS.
We evaluated the predictive value of HEART score for coronary stenosis in 155 patients who underwent CAG (145) or CTCA (10). The AUC was higher for SCS than for ACS when comparing the diagnostic accuracy of the HEART score (AUC, 0.737 [95% CI, 0.660–0.804] vs. 0.706 [95% CI, 0.627–0.776]). We also found that a low HEART score had a higher sensitivity, higher NPV, lower LR- for SCS than a low risk for ACS and a high HEART score had a higher LR+ than the high risk for ACS. This indicates that the diagnostic accuracy of the HEART score is better for SCS than ACS. Overall diagnostic performance of HEART score is also better for SCS than for ACS. This shows that HEART score can be considered a useful tool for determining early invasive measures based on the objective results of coronary visualization.
For patient distribution according to the five elements of HEART score, there was no difference in pain history and risk factor score between the ACS and non-ACS groups. There was no difference in the risk factor score alone between the SCS and non-SCS groups. In the adjusted HEART score, Backus et al. [13] lowered the value of the risk factor element and weighted history and troponin elements more heavily, calculating a maximum score of 14. There was some improvement in calibration and discrimination by adopting this adjusted score, but its clinical usefulness was relatively small because of the increased length of hospital stay by increasing the proportion of the patients in the intermediate-risk group. McCord et al. [14] proposed a modified HEART score that excluded troponin and was combined with serial testing of high sensitive cardiac troponin T over 1 hour. Our study shows the distribution of patients according to the score of each element and the significantly different elements between event and non-event groups. Thus, from a large scale study, modification of the HEART score by weighting significant factors or combining other diagnostic tools can be useful in increasing the diagnostic power for ACS and SCS.
Adult obesity is defined as BMI ≥30 kg/m2 in Western populations [15]. In our study, just 7.2% (15/207) of the included patients and 7.7% (12/155) of the patients who underwent coronary image examination had a BMI ≥30 kg/m2. However, for East Asians including Koreans, cutoff values for defining overweight and obesity are lower, at 25 kg/m2 [16]. Thus, in this study, we applied the Korean obesity criteria that defines obesity as a BMI ≥25 kg/m2. The prevalence of obesity in Korea was 32.4% in 2015 [15]. About 39.3% (82/207) of the included patients and 43.9% (68/155) of the patients who underwent coronary imaging examination were obese based on the Korean obesity criteria, which was higher than the aforementioned published prevalence. There were no significant differences in obesity between the ACS and SCS groups. There were also no statistically significant differences in the proportion of obese patients based on a Western BMI reference of ≥30 kg/m2 between ACS and SCS groups. Waist circumference (WC) is another indicator of obesity. Current diagnostic criteria for obesity are WC ≥90 cm for men and WC ≥85 cm for women. In future studies, modification of HEART score with WC instead of BMI should be considered.
Our study has some limitations. First, this study represents a retrospective observational study performed in a single urban academic ED. As such, our results cannot be generalized to other settings. Second, the included patients were admitted to the cardiology department and underwent coronary angiographic imaging studies. Thus, relatively high-risk patients were evaluated. Third, measurement points such as ECG and cardiac biomarkers may not have been standardized across our patient subset. However, we performed the ECG right after the hospital visit for patients who had chest pain, chest discomfort, and dyspnea. We also performed ECG within 30 minutes of most hospital visits for patients with non-specific symptoms such as epigastric pain. Cardiac biomarkers were also performed during the initial blood test in all patients. To answer these questions, a time controlled prospective study should be considered. Fourth, some patients were excluded due to their insufficient data, potentially skewing results. This is a common limitation of retrospective studies, however, we had a sufficient sample size to detect our primary outcome. Larger prospective studies would be necessary to determine the true diagnostic value of HEART score for ACS and SCS.
Overall, our study demonstrates that HEART score is a fairly useful prediction tool for ACS and SCS, with its predictive power being higher for SCS than for ACS. Further research is needed to improve the prognostic power to identify patients who require earlier angiography and revascularization in the ED.
Notes
No potential conflict of interest relevant to this article was reported.
References
Article information Continued
Notes
Capsule Summary
What is already known
The HEART score is a simple bedside risk stratification score system for chest pain patients in emergency department.
What is new in the current study
The HEART score is useful not only as a predictor of ACS, but also as a fair predictor of SCS.