INTRODUCTION
Maintaining adequate chest compression depth (CCD) during cardiopulmonary resuscitation (CPR) is closely related to patient survival [1]. The 2015 International Consensus on Cardiopulmonary Resuscitation and Emergency Cardiovascular Care Science with Treatment Recommendations advise rotating providers performing chest compressions every 2 minutes because the CCD decreases after 90 seconds of continuous chest compressions (CCCs) [2,3]. Although the quality of CPR also decreases during conventional CPR, the speed of decay is faster in CCC than in conventional CPR [4,5]. It is believed that the ventilation phase during conventional CPR may function as a rest period for rescuers; however, the evidence supporting this belief is lacking. This study was conducted to determine the reasons why rescuers could maintain adequate CCD for prolonged durations during conventional CPR.
METHODS
Study protocol
This study was a pilot study using an adult cardiac arrest simulation. The study protocol was approved by the institutional review board of the Chung-Ang University Hospital (C2015107[1565]). After providing their written informed consent, 20 health care providers (all certified American Heart Association Basic Life Support providers; one attending physician, two resident physicians, and 17 intern physicians) each performed 10 minutes of conventional CPR with a 30:2 chest compression to ventilation ratio using an adult cardiac arrest simulation on the floor. A Little Anne manikin (Laerdal Medical, Stavanger, Norway) was used as a simulated cardiac arrest patient. Mouth-to-mouth ventilation was performed with a face shield using the head-tilt/chin-lift maneuver. The performance of CPR was recorded using a CPRmeter (Laerdal Medical). The feedback screen was covered during the experiments. The rescuers’ real-time heart rates were recorded using the POLAR H7 heart rate sensor (Polar Electro Oy, Kempele, Finland), and the data were collected at 0.5-second intervals using the Heart Graph application (Smoky Cat Software Ltd., Warwick, UK).
Outcome variables
We selected several CPR parameters, including the average chest compression depth (ACD), average chest compression rate (ACR), average chest compression time in each CPR cycle (ACT), and average ventilation time in each CPR cycle (AVT), for the statistical analyses. All parameters were calculated using the average of each CPR cycle. In addition, we recorded the rescuers’ heart rates in real-time for 10 minutes.
Statistical analyses
All analyses were performed using the IBM SPSS Statistics ver. 23.0 (IBM Corp., Armonk, NY, USA). The variables were presented as mean±standard deviation. The Friedman test was used to determine whether the averaged CPR parameters in each CPR cycle changed significantly during the 10-minute period. In addition, the Wilcoxon signed-rank test was used to compare the variables between two different CPR cycles and to determine whether the rescuers’ heart rates decreased significantly in each CPR cycle. P-values <0.05 were considered statistically significant.
RESULTS
Twenty male medical doctors participated in this study. Their mean age was 27.6±3.7 years. Their mean body weight was 73.9±10.7 kg, and their mean height was 177.2±5.3 cm (average body mass index=24.6±3.4 kg/m2). The ACD and ACR for 10 minutes were 54.2±4.4 mm and 117.6±13.4 compressions/min, respectively. The rescuers performed 23.9±2.8 CPR cycles in 10 minutes. The ACT and AVT in all CPR cycles were 15.6±1.8 and 9.4±1.7 seconds, respectively. The chest compression fraction in 10 minutes was 63.7±4.3%.
Changes in the CPR parameters
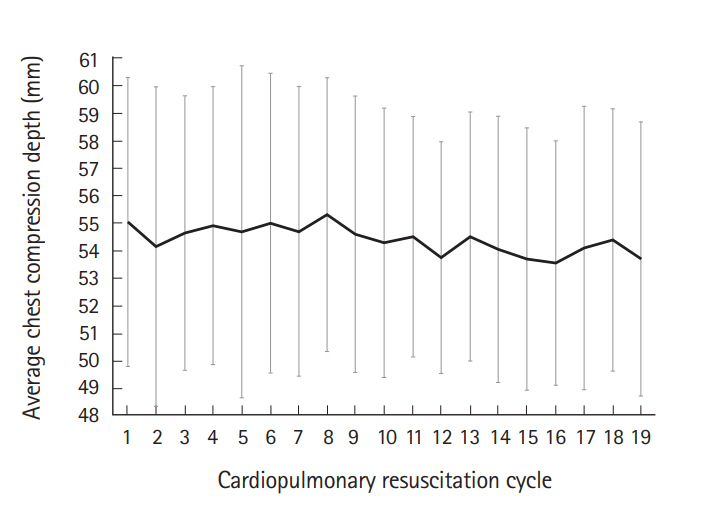
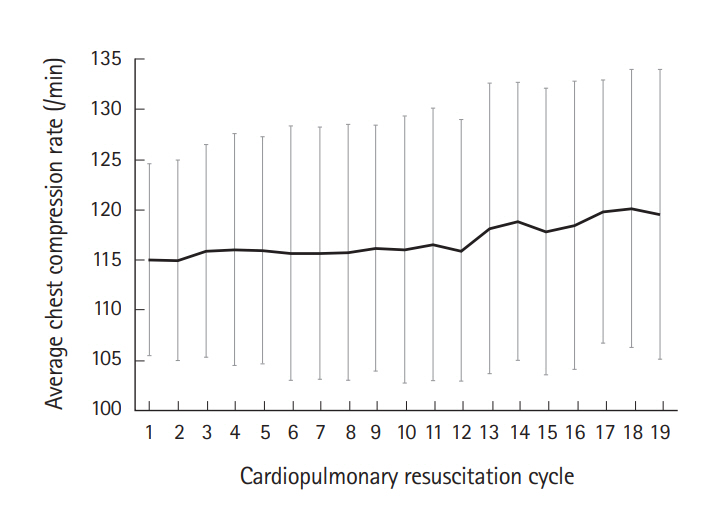
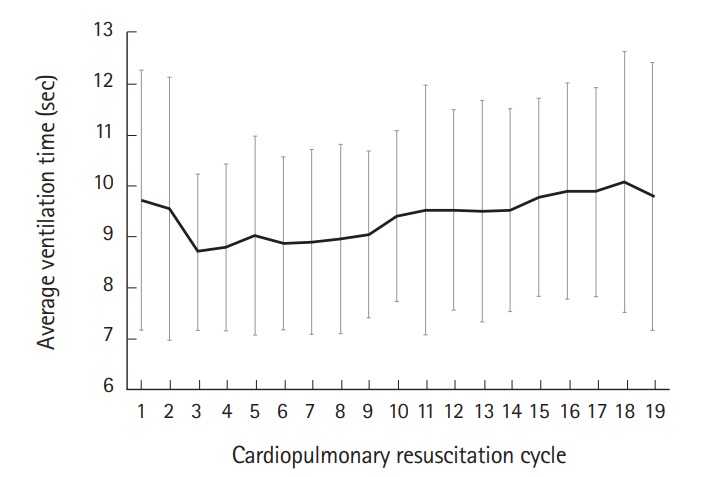
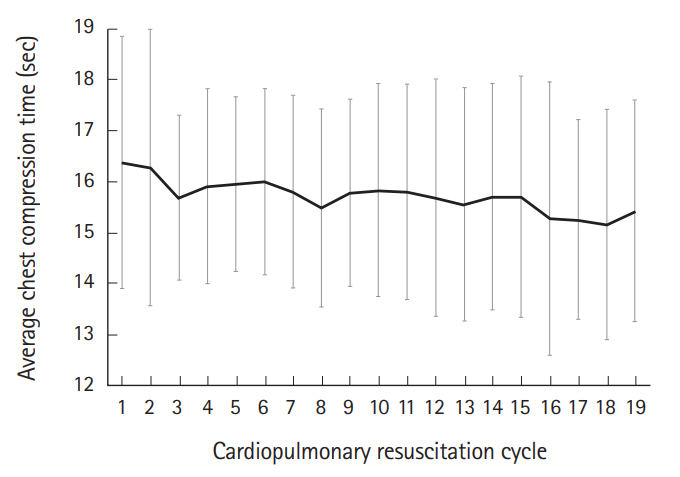
The ACD was maintained above 50 mm and was not significantly different during the 19 consecutive CPR cycles (P=0.597) (Fig. 1). However, the ACR and AVT were significantly different (P<0.001) (Figs. 2, 3). The ACR increased from 114.9±10.0 /min (2nd cycle: minimum value) to 120.1±13.8 /min (18th cycle: maximum value) (P=0.007) (Fig. 2), and the AVT increased from 8.7±1.5 seconds (3rd cycle: minimum value) to 10.1±2.6 seconds (18th cycle: maximum value) (P=0.002) (Fig. 3). The ACT was also significantly different during the 19 consecutive CPR cycles (P=0.002) (Fig. 4). However, the ACT showed a decreasing trend, unlike the ACR and AVT.
Changes in the rescuers’ heart rates
The rescuers’ heart rates increased gradually for 10 minutes (Fig. 5). However, they increased rapidly and were highest during the ventilation phase. Their heart rates then decreased and were lowest during the early chest compression phases of each CPR cycle. These changes were consistent during the 19 consecutive CPR cycles. The heart rates decreased significantly in all CPR cycles (average decrease: 14.5±4.5 beats/min [11.7±3.7% decrease from the preceding peak values], P<0.001).
DISCUSSION
To the best of our knowledge, this was the first study to evaluate changes in various CPR parameters including ACT and AVT and to measure rescuers’ heart rates in real-time during prolonged conventional CPR. Although some results were expected, other findings were unexpected. The expected results were changes in ACD, ACR and ACT. The unexpected findings were changes in AVT and rescuers’ heart rates. The ACD did not change during the 10 minutes of conventional CPR. Although the duration of our experiments was longer than previous studies, this result was basically the same as those of previous studies [4,5]. The increasing ACR also confirmed the results of previous studies [6]. The rescuers tended to compress the patient’s thorax faster as fatigue increased over time. We can easily expect that the increase in ACR reflects the rescuers’ fatigue because ACR increased in proportion to time [6]. The decrease in ACT was caused by increasing ACR because the number of chest compressions in each CPR cycle was fixed at 30.
Increasing AVT and changing patterns of rescuers’ heart rate were unexpected results. We expected that the rescuers’ heart rates would increase slowly throughout the experiment as fatigue increased. Previous studies also showed increasing patterns throughout the experiments [4,7,8]. The difference in our study was that we measured the rescuers’ heart rates in real-time, and this enabled us to record real changes in rescuers’ heart rates within the CPR cycles, especially in relation to the ventilation phase. Our results showed that the rescuers’ heart rates decreased significantly immediately after the ventilation phase of each CPR cycle. This result was clear evidence supporting the fact that the ventilation phase of each CPR cycle might act as a resting period. In addition, as rescuers’ heart rates increased and decreased with CPR cycles, the heart rate graph showed a serrated shape (Fig. 5). Although the rescuers’ heart rates decreased significantly immediately after the ventilation phase in all CPR cycles, it did not decrease to the baseline level. This result suggests that the rescuers’ fatigue could not be relieved completely during the ventilation phase of each CPR cycle.
The increasing AVT was also an unexpected finding. The AVTs of the first and second CPR cycles were higher than that of the third CPR cycle. This result might be caused by the adaptation period of the experiments because the AVT increased gradually after the third CPR cycle (Fig. 3). We supposed that the rescuers tended to increase the ventilation time according to the accumulation of fatigue. In summary, it can be assumed that the CCD was maintained adequately for a long period because of the ventilation phase.
There were several limitations to the present study. First, we recorded the rescuers’ heart rates as an objective index representing fatigue. However, heart rate alone is insufficient in determining the rescuers’ fatigue, as previously described [9]. Other factors, such as recent exercise, working hours, caffeine consumption, rescuers’ emotional states, and stress levels could affect the heart rate. Second, we recruited only male medical doctors to avoid ethical issues because we attached a heart rate sensor to the participant’s anterior chest wall to monitor heart rate in real-time during the trial. Thus, this could limit the generalizability of our findings. Third, we recruited only 20 participants without calculating the number of study participants because this was a pilot study. As a result, we could not perform multiple comparisons among the variables of each CPR cycle. Further studies are needed to confirm the exact trends of the variables over time. Fourth, we collected data using simulation experiments with a mechanical model. Therefore, the results have a limited applicability to human patients. In addition, the researchers observed all experiments during data collection. Therefore, the Hawthorne effect might have occurred. Fifth, the present study did not include the data from CCC. Therefore, we did not compare the parameters between CCC and conventional CPR. Despite these limitations, we believe that our data can provide theoretical evidence for CPR performance and physiologic changes in rescuers during conventional CPR.
In summary, the ACD was maintained adequately during 10 minutes of conventional CPR. However, the AVT increased significantly during the 10-minute period. The rescuers’ heart rates increased and decreased throughout all CPR cycles. These results showed that the ventilation phase might play a role as a resting period and be a reason for the maintenance of adequate CCD for a longer time during conventional CPR.


