


INTRODUCTION
Out-of-hospital cardiac arrest (OHCA) affects approximately 300,000 Americans and 25,000 Koreans every year. OHCA is a significant global public health issue that can cause disability or even death [1,2]. Despite the fact that the survival rate of OHCA patients has improved over time and new treatment strategies such as targeted temperature management have improved neurological outcomes, the mortality and permanent brain damage rates of OHCA patients remain high [3,4]. However, the identification of OHCA patients at risk of developing neurological complications using a neurological evaluation in an emergency department is difficult [5].
The early determination of neurologic outcomes is an essential element of risk stratification to identify aggressive treatment for OHCA patients. Additionally, there is a need to identify prognostic factors to accurately predict the neurologic outcome of OHCA patients who receive successful cardiopulmonary resuscitation (CPR) as early as possible, while numerous studies have focused on discovering these factors. Among the possible prognostic factors, serum biomarkers and coagulation/fibrinolysis markers can be measured easily and repetitively on patients using simple invasive methods that can also be easily applied in the clinical setting. Neuron-specific enolase (NSE) levels correlate well with other markers of ischemic brain injury [6], and S100-B protein (S100-B) is reliable as an initial predictor within 24 hours [7]. Procalcitonin (PCT) and D-dimer are released early after resuscitation following OHCA and are accurate predictors of a poor outcome [8,9]. However, some studies have concluded that there is no association between biomarker levels and mortality [10].
Previous studies predicted prognosis via independent examinations of specific markers or examinations at specific time points after the first 24 hours of return of spontaneous circulation (ROSC). The accuracy of prognostic prediction has been assessed using markers from specific groups such as biomarkers of brain injury, cardiovascular ischemic events and inflammation or coagulation/fibrinolysis markers. This study did not limit the markers to specific groups or examination results to a specific time point; instead, it targeted patients treated with therapeutic hypothermia (TH) and included results up to 72 hours after ROSC because there are various results of optimal timing for prognostication using biomarkers. The primary objective of this study was to perform a comparative analysis of various markers of neurological prognosis prediction in OHCA patients. The secondary outcome was to determine if the presence of multiple markers improved prediction accuracy.
METHODS
From January 2011 to December 2016, we conducted a retrospective observational study of patients who received TH at a Korean university hospital. The study targeted OHCA patients>8 years of age and unconscious patients after ROSC defined as a Glasgow coma scale score (GCS)≤8 and was approved by the institutional review board (SC16RISI0049), which waived the need for informed consent since all interventions were part of standard patient care.
The exclusion criteria were as follows: failure to achieve ROSC; age≤17 years; past history of irreparable brain damage (Glasgow-Pittsburgh cerebral performance categories [CPC] 3–4); recovery of consciousness after ROSC (GCS>9) without undergoing TH; death within 3 days after ROSC; did not receive TH; known hematological disease; and lack of serum biomarker and coagulation/fibrinolysis marker examination results.
The post cardiac arrest care procedures performed on the study subjects were based on the CPR guidelines from the American Heart Association and Korean CPR Association [11,12]. To reach the target temperature, induction was started immediately after ROSC with ice packs and intravenous ice-cold fluids. TH was maintained using temperature control pads (Arctic Sun Temperature Management System, Medivance Corp., Louisville, CO, USA) or an intravascular catheter (Coolgard 3000 Catheter Thermal Regulation System, ZOLL Medical Corp., Chelmsford, MA, USA). TH was maintained at 33±1°C for 24 hours. All patients were admitted to the intensive care unit and received standard intensive care including invasive monitoring, hemodynamic support, mechanical ventilation, analgesia, and sedation.
Blood samples were collected from an arterial line during the course of routine intensive care immediately after and 24, 48, and 72 hours after ROSC. NSE, S100-B, procalcitonin, troponin I (Tn-I), creatine kinase-MB, pro-brain natriuretic protein (pro-BNP), D-dimer, fibrin degradation product (FDP), antithrombin III, fibrinogen, and lactate were measured from the collected blood samples in accordance with institution-specific TH protocols. Missing samples resulted from the transfer of patients between other departments or hospitals and samples not being collected at the correct time according to the protocol. Selection bias may have confounded the results. Demographic data, clinical parameters, and comorbidities (previous cardiac arrest, myocardial infarction, angina, heart failure, stroke, hypertension, diabetes mellitus, lung disease, renal disease, and malignancy), cause of cardiac arrest, initial heart rhythm, cardiac arrest witness status, bystander CPR, time before ROSC, and GCS score after ROSC were retrospectively collected. For the neurological prognosis evaluation of individual patients, CPC (categories 1–5) was used and based on the recommendations of the Utstein templates [13]. The CPC information indicating the best performance at hospital discharge was recorded. Individual CPC levels were defined as follows: CPC 1, conscious and alert with normal neurological function or only slight cerebral disability; CPC 2, conscious with moderate cerebral disability sufficient for part-time work in a sheltered environment or independent existence; CPC 3, conscious with severe cerebral disability precluding independent existence; CPC 4, comatose or in a persistent vegetative state; and CPC 5, brain dead. The patients were then classified into two groups according to neurological outcomes: the poor neurological outcome group (CPC 3–5) and the good neurological outcome group (CPC 1–2). The neurologic outcome was compared with the biomarker representing the best area under the receiver operating characteristic curve (AUC) value or with a coagulation/fibrinolysis marker, and the AUC values measured at each time point were analyzed.
All central values are presented are medians unless otherwise stated. Distributions are expressed as interquartile ranges. Categorical variables are expressed as count and proportions. Frequencies were compared using Fisher exact test. Non-parametric tests were used for group comparisons with the Mann-Whitney U-test to assess differences in biomarker concentrations across outcome groups, while the Kruskall-Wallis test was used when comparing more than two groups since the data were not normally distributed upon visual inspection. The predictive accuracy of the markers was calculated as the AUC. The optimal cutoff value was calculated using the Euclidean method. Two-tailed P-values<0.05 were considered significant. Finally, we compared two or more receiver operating characteristic (ROC) curves using the AUC comparison analysis method and calculated the integrated discrimination improvement (IDI) and the net reclassification improvement (NRI) with the category-free option among models [14,15].
RESULTS
Overall, 102 patients were included in the study during the research period (Fig. 1). The baseline features were compared between patients with different neurological results (Table 1). There were 39 patients with good neurologic outcomes (38.2%) and 63 with poor neurologic outcomes (61.8%). There were no differences in age, sex, previous comorbidities, whether the cardiac arrest was witnessed, or the implementation of bystander CPR between the two groups. However, there were differences in first monitored cardiac arrest rhythm, time from OHCA to ROSC, cause of OHCA, and GCS score after ROSC.
Predictive accuracy of serum biomarkers and coagulation/fibrinolysis markers
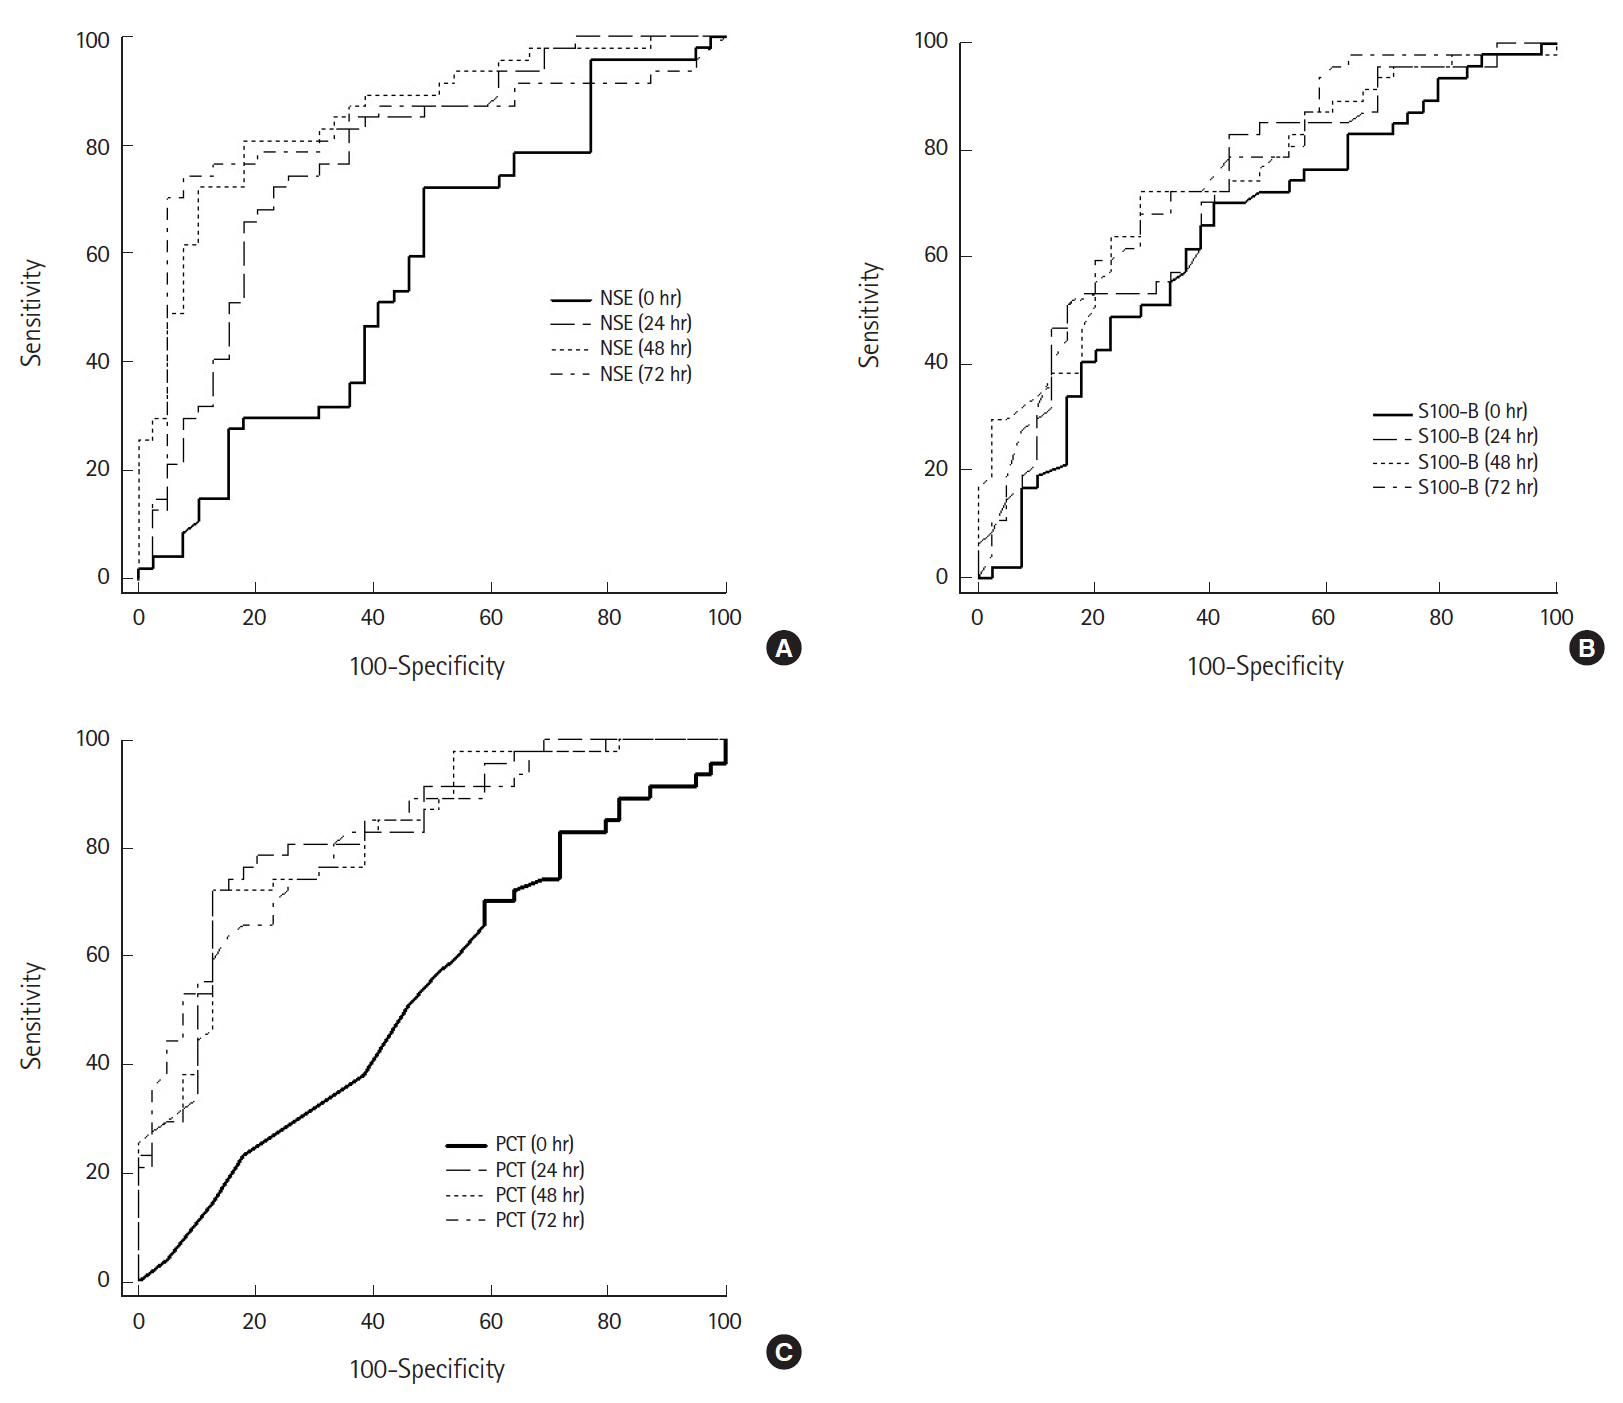
The mean NSE in patients with good neurologic outcomes measured 72 hours after ROSC was 17.64 ng/mL, which was significantly lower than in patients with poor neurologic outcomes (77.15 ng/mL, P<0.001) (Table 2). Additionally, the AUC calculated on ROC analysis predicting poor neurologic outcome was 0.92 (95% confidence interval, 0.85 to 0.99; P<0.001), which demonstrated the best predictive power among all markers included in the study analysis (Fig. 2). The AUC values for predicting a poor neurologic outcome consistent with predictive power were found only in NSE and PCT. The AUC values of NSE were 0.83 (24 hours), 0.92 (48 hours), and 0.92 (72 hours) while those of PCT were 0.85 (24 hours) and 0.82 (48 hours). The S100-B was significantly different between the two groups when measured immediately and 24, 48, and 72 hours after ROSC. However, the AUC values of S100-B were lower than those of NSE and PCT. Although S100-B was significantly different between the two groups when measured immediately after ROSC (1.14 vs. 2.11 μg/L, P<0.001), the AUC value was 0.66.
The AUC for predicting a poor neurologic outcome was highest for NSE (72 hours), with a sensitivity of 87% and specificity of 94% at a cutoff of 33.2 ng/mL. Among the coagulation/fibrinolysis markers, fibrinogen (48 hours), D-dimer (72 hours), FDP (72 hours), and fibrinogen (72 hours) were significantly different between groups and the AUC values were 0.65, 0.69, 0.66, and 0.69, respectively. The overall AUC values of NSE, S100-B, and PCT were higher than those of the coagulation/fibrinolysis markers as well as frequently used biochemical markers of cardiovascular ischemic events such as Tn-I, creatine kinase-MB, and pro-BNP.
The NSE, S100-B, and PCT values were different at 24 hours after ROSC. However, the mean Tn-I value was 3.77 vs. 1.63 ng/mL, significantly higher in patients who had a good neurologic outcome. Among the laboratory results at 48 hours, the lactate (1.61 vs. 2.20 mmol/L) and fibrinogen (301.90 vs. 354.00 mg/mL) values differed between the two patient groups as well. Among the coagulation/fibrinolysis markers measured after 72 hours, D-dimer, FDP, and fibrinogen were significantly different between the two groups.
Improving prognostic accuracy with marker combinations
To improve prediction accuracy for poor neurologic outcomes, we compared the AUC of different markers with that of NSE (72 hours) at various time points. Although the AUC value of NSE (48 hours) was similar to the AUC value of NSE (72 hours), the actual measured values were 0.916 and 0.922, respectively. NSE (72 hours) was selected as a reference according to the primary objective of the study. Based on the AUC values, NSE (72 hours) predicted neurological prognosis significantly better than the S100-B and PCT (72 hours), cardiovascular biomarkers and coagulation/fibrinolysis markers. PCT values at 24 hours and 48 hours were not significantly different in AUC but were significantly different from NSE in the relative IDI and category-free NRI models (Table 3).
To estimate whether NSE (72 hours) levels directly corresponded to poor neurologic outcomes in OHCA patients, we compared the probabilities of events and nonevents of models using the relative IDI and category-free NRI models. The addition of other biomarkers to NSE did not show a significant increase in the IDI. The addition of PCT (48 hours) to NSE (72 hours) resulted in an IDI of -0.03 (P=0.08) and an NRI of -0.50 (P<0.05) but did not improve the AUC (0.92 vs. 0.93, P=0.42). The addition of S100-B to NSE (72 hours) and PCT (48 hours) provided an IDI of -0.01 (P=0.28) and an NRI of -0.27 (P=0.69) and did not improve the AUC (0.93 vs. 0.93, P=0.69). Additionally, the relative IDI and category-free NRI models did not show an improved prognostic value even when combined with cardiovascular biomarkers, coagulation/fibrinolysis markers, and NSE (72 hours).
DISCUSSION
In this study, NSE, S100-B, and PCT values measured at 24, 48, and 72 hours were significantly related to neurological prognosis in OHCA patients. However, the addition of S100-B or PCT values to the NSE values did not improve the predictive power due to the high predictive value of NSE at 72 hours after ROSC.
Based on past experience, prognostic guidance can significantly impact clinical decisions in OHCA patients regarding the direction of treatment, treatment enhancement efforts, reestablishment of overall management, or withdrawal of treatment. Several studies have focused on patient characteristics, clinical setting, neurological examination, radiological results, and electrophysiology as prognostic factors, but due to the heterogeneity among different cardiac arrest populations and scenarios, no prognostic factors with credible results have been identified. Thus, despite numerous studies in the field, the time period and optimal approach to determining prognosis remain controversial issues. To our knowledge, this is the first study to predict prognosis in OHCA patients by measuring serum biomarkers and coagulation/fibrinolysis markers at various time points.
According to the CPR guidelines published by the American Heart Association in 2015, it is recommended that NSE and S100-B not be used alone to predict prognosis and that persistently high NSE values measured at 48 to 72 hours can be used to predict poor neurological prognosis in combination with other prognostic factors [11]. The results of predicting mortality using NSE and S100B showed that both levels were high when neurological injury was severe at the initial examination. Persistently elevated NSE and S100-B levels at 48 and 72 hours were associated with death [16]. The report from the Quality Standards Subcommittee published by the American Academy of Neurology in 2006 described a systematic review of accurate prediction factors of poor neurologic outcomes after cardiac arrest, which included NSE >33 ng/L within 1 to 3 days after the ischemic event [17]. Even though the cutoff value remains controversial, follow-up studies verified the usefulness of NSE [6,18]. Previous studies argued that S100-B is more useful in predicting neurologic outcomes during the early stages of OHCA compared with NSE [7,19,20], but other studies have argued the opposite. Such discordance could be related to the differences among the patient groups (origin of cardiac arrest, use or nonuse of TH, age limit) studied, and additional investigations are required to determine the optimal biomarker to predict results after cardiac arrest. In this study, NSE was more accurate than S100-B. Even though the S100-B values showed statistically significant differences in accordance with prognosis at 72 hours after ROSC, NSE measured at 48 hours and 72 hours showed higher AUC values. NSE and S100-B are commonly released into the cerebrospinal fluid and then the systemic circulation after neuronal injury. NSE has been shown to be located in neurons and neuroectodermal cells, while S100-B is found in astroglial and Schwann cells. The results of this study may be due to the differences in sensitivity for hypoxia between neurons and astrocytes. In addition, the presence of extraneuronal sources of biomarkers cannot be completely excluded. The NSE (72 hours) results were more useful than the S100-B results in the relative IDI and category-free NRI models.
Previous studies have evaluated the prognosis of cardiac arrest patients using pro-inflammatory stimuli, especially increases in PCT after reacting with materials of bacterial origin [8,21]. According to these studies, PCT showed a pattern of early secretion after cardiac arrest and a higher association with prognosis than inflammation. Additionally, PCT measured within 24 hours after ROSC was useful for prognosis prediction. However, unlike other studies comparing inflammatory markers other than PCT, this study simultaneously sampled markers such as NSE, S100-B, Tn-I, and D-dimer and compared these values to PCT. PCT had greater predictive power than other factors and showed a significant difference in accordance with prognosis at 24, 48, and 72 hours. However, this parameter did not exceed the accuracy of NSE. Additionally, even though the results were not statistically significant, it should be noted that the model combining NSE (72 hours) and PCT (48 hours) presented the best predictive power. The major limitation of using inflammatory biomarkers to predict prognosis after cardiac arrest is that all inflammatory conditions can increase the circulation levels of biomarkers, which leads to lower specificity regarding ischemic insult. Furthermore, various inflammatory conditions that can occur after cardiac arrest can change the prognostic power of biomarkers.
Markers of activated blood coagulation start to increase at the point of cardiac arrest through CPR until ROSC and slowly decreased over the 24 hours after ROSC [22]. Additionally, endothelial injury similar to severe sepsis occurs during cardiac arrest and activates the extrinsic coagulation pathway and leads to disorders in the protein C anticoagulant pathway. As such, studies predicting the outcomes of OHCA patients using coagulation/fibrinolysis markers have also been conducted [9,23]. However, these studies focused on mortality rather than associations among neurologic outcomes and markers. These studies did not measure markers continuously; rather, they examined levels only immediately after ROSC. Here we analyzed the association among coagulation/fibrinolysis markers and neurologic outcomes; the results did not indicate significant associations among any of the items mentioned above. The coagulation/fibrinolysis markers were not accurate for predicting the neurological prognosis of OHCA patients treated with TH. In a targeted temperature management trial sub-study, high-sensitivity troponin T was an independent marker of both all-cause mortality and death due to cardiovascular causes or multiorgan failure regardless of the cause of arrest [24]. However, our results showed that the levels of biomarkers of cardiovascular ischemic events are significantly higher in patients with good neurological outcomes. This was caused by the failure to control various factors that may affect biomarkers.
A recent pilot study predicted outcomes using a combination of biomarkers [25]. NSE (48 hours) as a single biomarker had high predictive value for poor neurologic outcome after cardiac arrest and showed an increased AUC when combined with two other biomarkers, mid-regional atrial natriuretic peptide and troponin T, which originate from heart tissue. However, this increase was not statistically significant. In this study, the AUC of NSE (72 hours) was 0.92, which was lower than 0.94 in a previous study and increased when combined with other biomarkers, but this increase was not statistically significant. Thus, there is a need for additional research to improve predictive power through single and combination biomarkers. Additional research is needed in a larger and multicenter trial to determine all causes of cardiac arrest and control confounders influencing biomarkers.
In our study, bystander CPR did not affect neurological prognosis. The good neurological outcome group had a relatively higher bystander CPR rate, but the rate was statistically insignificant. In Korea, the rate of CPR education increased from 45.4% in 2006 to 50.6% in 2015, while the high-quality education completion rate including manikin training within 2 years increased from 5.6% to 28%. CPR training was received at military institutions and schools, and most of the education is compulsory or group-oriented. However, the actual rate of witness bystander CPR implementation is still low despite increasing from 2.3% in 2006 to 13.1% in 2010 [26]. According to previous studies, the ROSC rate before hospital arrival was approximately 1.5%. The rate of ROSC was high, up to 7.3 times higher when the first witness was a healthcare professional, while bystander CPR was administered by the general public at a rate that was four times higher.
This study had several limitations. First, as a retrospective study in a single center, one must consider the risk of bias. There may be a sample selection bias and a lack of planned or necessary information. Second, the study group sample was too small to draw conclusions. Thus, the study results and hypothesis must be verified through a larger and multicenter trial. Third, the study was limited to subjects whose blood was continuously sampled for 72 hours after ROSC and did not include patients who died within 72 hours. Considering the exclusion of patients with relatively poor prognoses, the prognostic power of the initial markers could have been biased. Fourth, because this was an observational study based on medical record review, we could not confirm the degree of education of the bystanders who performed CPR. Finally, since the study did not classify patients according to the methods used to conduct TH, it was unable to exclude the influences of the temperature control pad and intravascular catheter.
In this study, NSE (72 hours) showed the best predictive power for neurological prognosis in patients who received TH among blood markers that can be easily and repeatedly measured with simple invasive methods, including brain damage, inflammation, and cardiovascular and coagulation/fibrinolysis markers. The predictive power of S100-B and PCT measured from 24 hours to 72 hours after ROSC was significantly higher than that of cardiovascular markers and coagulation/fibrinolysis markers. Although biomarker combinations did not improve prognostic accuracy, further verification through large-scale studies is needed.