| Home | E-Submission | Sitemap | Contact Us |  
Search
Clin Exp Emerg Med Search

CLOSE

Clin Exp Emerg Med > Volume 6(4); 2019 > Article
Kim, Chon, Oh, and Cho: Determination of the theoretical personalized optimum chest compression point using anteroposterior chest radiography

Abstract

Objective

There is a traditional assumption that to maximize stroke volume, the point beneath which the left ventricle (LV) is at its maximum diameter (P_max.LV) should be compressed. Thus, we aimed to derive and validate rules to estimate P_max.LV using anteroposterior chest radiography (chest_AP), which is performed for critically ill patients urgently needing determination of their personalized P_max.LV.

Methods

A retrospective, cross-sectional study was performed with non-cardiac arrest adults who underwent chest_AP within 1 hour of computed tomography (derivation:validation=3:2). On chest_AP, we defined cardiac diameter (CD), distance from right cardiac border to midline (RB), and cardiac height (CH) from the carina to the uppermost point of left hemi-diaphragm. Setting point zero (0, 0) at the midpoint of the xiphisternal joint and designating leftward and upward directions as positive on x- and y-axes, we located P_max.LV (x_max.LV, y_max.LV). The coefficients of the following mathematically inferred rules were sought: x_max.LV=α0*CD-RB; y_max.LV=β0*CH+γ00: mean of [x_max.LV+RB]/CD; β0, γ0: representative coefficient and constant of linear regression model, respectively).

Results

Among 360 cases (52.0±18.3 years, 102 females), we derived: x_max.LV=0.643*CD-RB and y_max.LV=55-0.390*CH. This estimated P_max.LV (19±11 mm) was as close as the averaged P_max.LV (19±11 mm, P=0.13) and closer than the three equidistant points representing the current guidelines (67±13, 56±10, and 77±17 mm; all P<0.001) to the reference identified on computed tomography. Thus, our findings were validated.

Conclusion

Personalized P_max.LV can be estimated using chest_AP. Further studies with actual cardiac arrest victims are needed to verify the safety and effectiveness of the rule.

INTRODUCTION

Optimum chest compression is critical for successful cardiopulmonary resuscitation (CPR). The current CPR guidelines have emphasized a specific rate (100–120 beats/min), depth (5–6 cm), full recoil after each compression, and minimizing pauses for compression [1,2]. However, they allow a relatively broad range region, the lower sternal half (approximately 9 cm), to compress [3].
This compression site for the general population has been determined by the studies that assumed that the stroke volume (SV) of the left ventricle (LV), a key point for successful CPR, would be maximized by compressing the theoretical optimum ‘point’ (P_max.LV) beneath which the LV is at its maximum diameter [3-11]. Using these rationale, the authors suggested that ‘personalized P_max.LV’ should be compressed considering the wide variations in cardiac locations among individuals. Additionally, it was suggested that it would be important to determine ‘personalized P_max.LV’ using posteroanterior chest radiography (chest_PA), as patients suffering from myocardial infarction are considered for personalized therapy [12-14]. Assuming that the relative location of P_max.LV within the heart would be constant universally, we mathematically derived and validated rules to locate P_max.LV using simple parameters measured on chest_PA, including cardiac diameter, right cardiac border, and cardiac height (Fig. 1A) [12].
To apply the rules without the interruption of CPR, chest_PA should be performed before the cardiac arrest (CA). Due to the lack of previously investigated chest_PAs, these rules are applicable to only 71% and 38% of in-hospital CA (IHCA) and out-of-hospital CA (OHCA) victims, respectively [12]. This limited applicability might have reached up to 100% and 60%, respectively, if P_max.LV had been estimated using anteroposterior chest radiography (chest_AP). Chest_PA requires patients to stand up alone and take a deep breath; critically ill patients who are unable to do this are required to undergo portable chest_AP instead. As such patients at a higher risk for CA, need more urgent and proactive determination of personalized P_max.LV [15-17].
In this study, we aimed to derive and validate the rules to determine personalized P_max.LV using the chest AP. We used the same methods as Cho et al. [12] except we used chest_AP instead of chest_PA. First, we identified the 3D coordinates of P_max.LV on computed tomography (CT) which is the reference standard test. Subsequently, we derived and validated rules to estimate each coordinate using parameters which were easily measurable on chest_AP.

METHODS

Design, setting, and participants

In this retrospective cross-sectional study, we included all consecutive non-CA adults aged ≥18 years who had undergone chest_AP within 1 hour of CT with sagittal reconstruction from 2012 to 2017 in CHA Bundang Medical Center. The institutional review board of the hospital approved this study protocol (2018-06-016-002). The requirement for informed consent was waived for this retrospective study.
We excluded cases that required alteration in cardiopulmonary modifying medications between performing chest_AP and CT (anti-hypertensives, diuretics, inotropics, chronotropics, fluid loading, beta agonists, and anticholinergics) and those with any immeasurable parameters on either test. Cases with the following thoracic abnormalities were included as they were found not to affect the rules in the determination of P_max.LV in the previous study: >2-cm depth pleural effusion, >1-cm depth hemo-/pneumothorax, a destroyed lung, lobectomy, atelectasis, hiatal hernia, >5-mm depth pericardial effusion, pericardial tumor/cyst, thoracic aorta dissection/aneurysm, and widened mediastinum [12]. We assigned enrolled cases randomly to derivation and validation sets using a 3:2 ratio, respectively.

Definition of structures on chest_AP, the chest surface, and CT

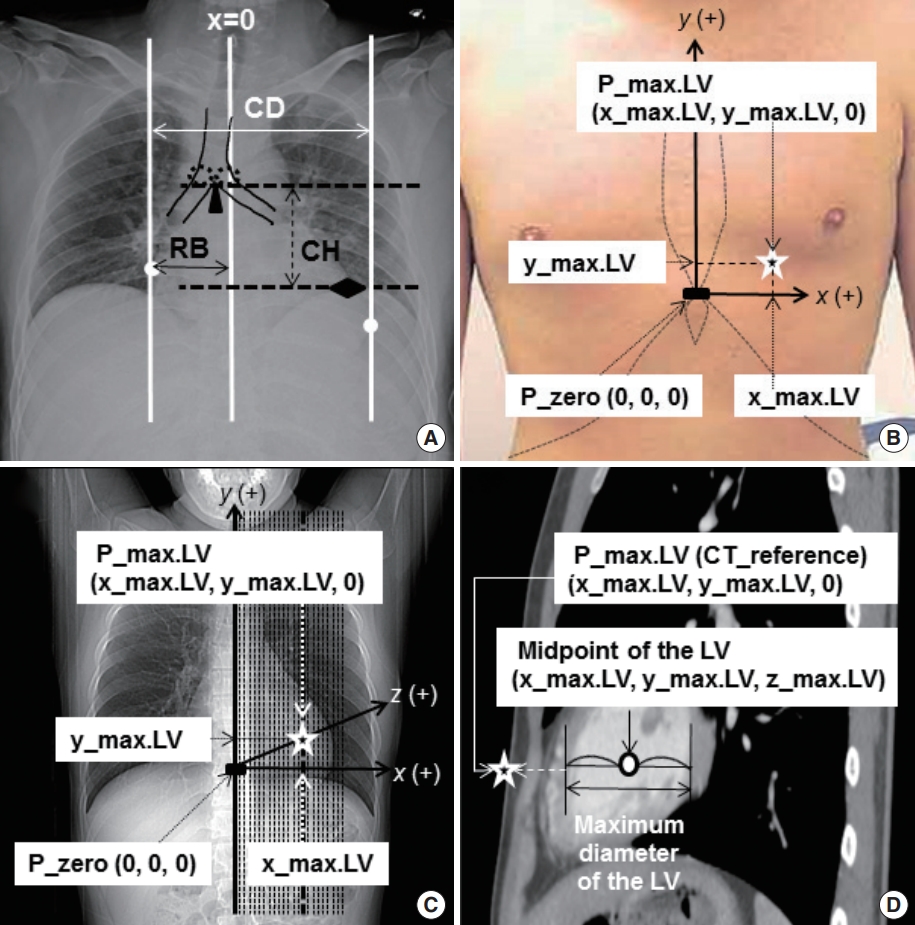
We defined anatomical structures on chest_AP, the chest surface, and CT as described by Cho et al. [12] From the chest_AP, cardiac diameter (CD) was defined as the distance from the right cardiac border (RB) to the left one. We defined cardiac height (CH) as the distance from the bottom of the carina to the uppermost point of the left hemi-diaphragm (Fig. 1A) [12].
The reference point, (P_zero [0, 0, 0]), was defined as the midpoint of the xiphisternal joint on both the chest surface and CT. Leftward, cephalad, and into-the-thorax directions were designated as positive on x-, y-, and z-axes, respectively (Fig. 1B, C) [12].
The midpoint of the LV where it showed the maximum diameter was identified using CT as follows: x_max.LV, y_max.LV, z_max.LV. P_max.LV, which was assumed to be located just vertically above that point on the chest surface (z=0), was then positioned at the following location: x_max.LV, y_max.LV, 0 (Fig. 1C, D) [12].

Mathematical derivation of the rule to estimate P_max.LV

Assuming that the relative location of P_max.LV within the heart does not change interpersonally, its proportional width and height compared with CD and CH would remain constant. Using this assumption, we have inferred the following rules to estimate x_max.LV and y_max.LV, where α0, β0, and γ0 were constants derived from the study population [12];
x_max.LV=α0*CD-RB
y_max.LV=β0*CH+γ0
(For detailed mathematical inference, please see explanation S1 of reference number 12).
Using the derivation set, we measured x_max.LV and y_max.LV on CT; and CD, RB, and CH on chest_AP. Using these measurements, we defined α0 as the mean value of ‘(x_max.LV+RB)/CD’. β0 and γ0 were determined as the representative regression coefficient and constant, respectively, revealed on the linear regression analysis to express y_max.LV in terms of CH. We then investigated whether the assumptions of the linear regression analysis were met. By determining α0, β0, and γ0 mentioned as above, we could derive the rules to estimate x_max.LV and y_max.LV to locate P_max.LV.

Validation of the rule to estimate P_max.LV

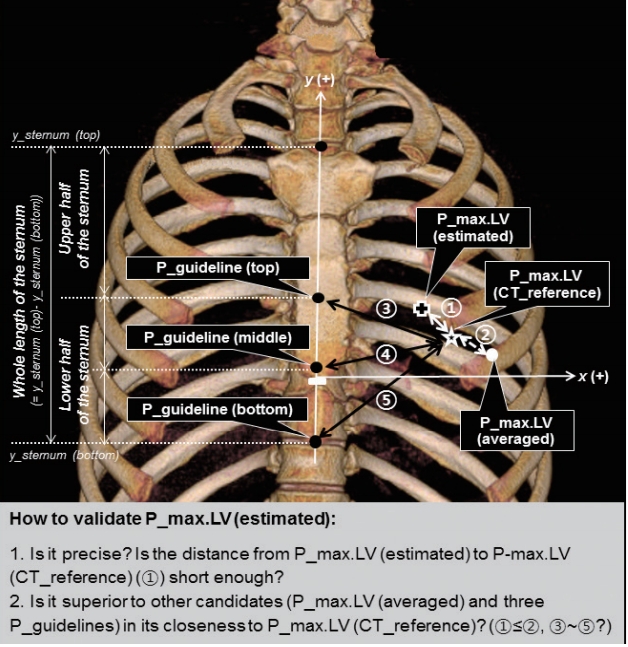
We validated the derived rules to estimate P_max.LV in two ways (Fig. 2). First, to assess the precision of the estimated P_max.LV (P_max.LV [estimated]), we compared its coordinates with those of the reference point identified using CT (P_max.LV [CT_reference]).
Second, we checked the superiority of P_max.LV (estimated) over two kinds of candidate compression points. Thus, we compared the proximity of P_max.LV (CT_reference) to P_max.LV (estimated) with that of each candidate point. The first candidate was P_max.LV (averaged). We defined its coordinates as the mean value of x_max.LV and y_max.LV of all enrolled cases. The second candidate was three P_guidelines to represent the compression site recommended in the current CPR guidelines [1,2]. These were located along the lower mid-sternal half at the same interval from the top to the bottom per individual as P_guideline (top), P_guideline (middle), and P_guideline (bottom).

Comparison with the previous study to determine P_max.LV with Chest_PA

In order to compare the results of the current study with those from the previous study in which we determined P_max.LV using chest_PA, we compared the variables using unpaired t-tests, chi-square tests, and others [18].

Measurement of variables

One author (KS) measured all parameters in all patients. To verify interrater reliability, another (CS) measured CD, RB, CH; x_max.LV, y_max.LV, and y coordinates of the sternal top (y_sternum [top]) and bottom (y_sternum [bottom]) among 8% of cases that were randomly selected. The intra-class correlation coefficient was calculated for each variable.
Data on sex, age, height, weight, and comorbidities were obtained from patient medical records. Body mass index was calculated as ‘weight (kg)/height (m)2’.

Statistical analysis

Demographic information, comorbidities, parameters on chest_AP and CT, and α0, β0 and γ0 were shown in derivation, validation, and combined sets. Continuous variables were presented as mean± standard deviations and were compared using t-tests. Categorical variables were presented as proportions (%) and were compared using chi-squared tests.
We defined type 1 and 2 errors as <0.05 and <0.10, respectively. Expecting the correlation coefficient (r) to be >0.25 for the linear regression analysis to estimate the y_max.LV with CH, the sample size of the derivation set had to be ≥164. Allotting cases to derivation and validation sets in a 3:2 ratio and assuming a loss rate as 0.4, we reviewed ≥456 cases [19].
Statistical analyses were performed using IBM SPSS Statistics ver. 24 (IBM Corp., Armonk, NY, USA). Statistical significance was presumed when two-sided P-values were <0.05.

RESULTS

In total, 482 patients had chest_AP and CT performed within 1 hour of each other. Among them, 122 cases were excluded: 43 cases for receiving medication between chest_AP and CT and 79 cases for unmeasurable variables in either test. Finally, 360 cases (mean age±standard deviation 52.0±18.3 years, 102 [28.3%] females) were enrolled.
We randomly assigned 237 (65.8%) and 123 (34.2%) cases to the derivation and the validation sets, respectively. There were no significant differences in sex, age, body habitus, comorbidities, and structural abnormalities between the sets (Tables 1, 2).
Intra-class correlation coefficients to reveal the interrater reliability in measuring CD, RB, CH, x_max.LV, y_max.LV, y_sternum (top), and y_sternum (bottom) were all >0.95 (P<0.001, n=30) (Table 3).
With the derivation set, α0 was 0.643±0.073, showing a normal distribution (Kolmogorov-Smirnov, P=0.20). As the mean of x_max.LV and y_max.LV was 52 and 11 mm, respectively, we located the P_max.LV (averaged) at (52 mm, 11 mm). The assumptions of the linear regression analysis were met to express y_max.LV in terms of CH. The regression analysis revealed the following:
y_max.LV=60-0.425*CH
(r=0.351, β0: -0.425 [95% confidence interval, -0.556 to -0.294], P<0.001; γ0: 60 [95% confidence interval, 45 to 75], P<0.001)
Using those representative statistics, we could estimate P_max.LV as follows:
x_max.LV=0.643*CD-RB (mm)
y_max.LV=60–0.425*CH (mm)
We validated these rules by applying them to the validation set (Table 1 and Fig. 2) [12]. The distance from P_max.LV (estimated) to P_max.LV (CT_reference) was 20±11 mm; this did not significantly differ when compared with the distance from P_max.LV (averaged) (19±11 mm) to P_max.LV (CT_reference) (P=0.13). When compared with the distance from the three P_guidelines to P_max.LV (CT_reference), 67±13, 56±11, and 76±18 mm, respectively, it was significantly shorter (P<0.001).
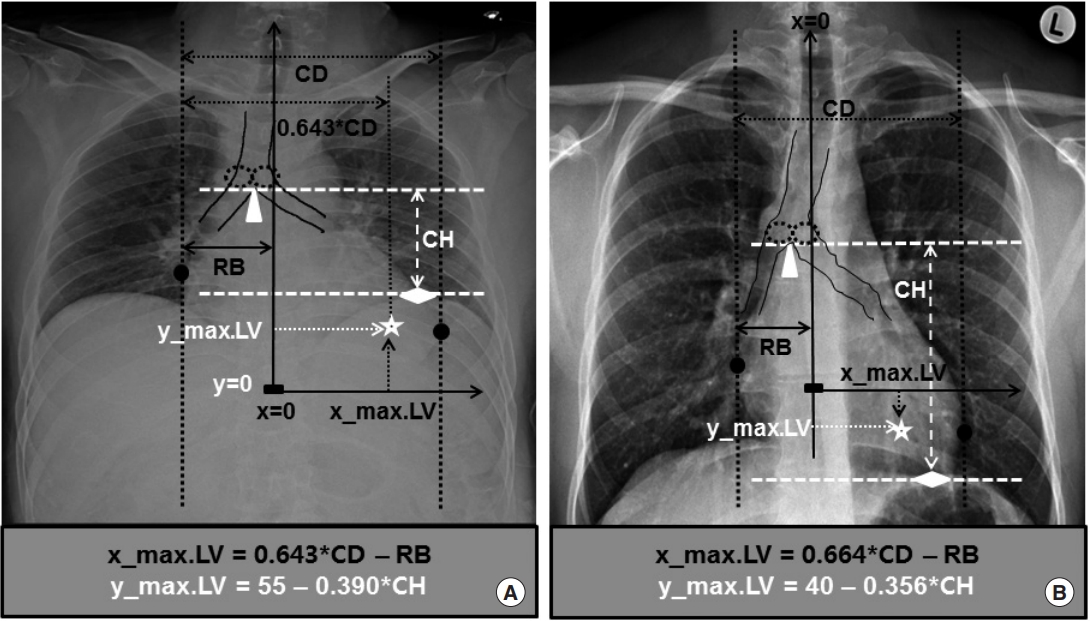
Reanalyzing using the whole set of combined cases, we obtained the following modified rules to estimate P_max.LV on chest_AP (Fig. 3A) [12]:
x_max.LV=0.643*CD-RB (mm)
y_max.LV=55–0.390*CH (mm)
When these rules were applied to the whole set, the result of validation was similar (Table 1).
Compared with the previous study that had estimated P_max.LV using chest_PA, the population for whom chest_AP was performed in the current study had fewer women and younger, taller, and heavier individuals (Table 4). Additionally, the population had a larger CD and RB, and a smaller CH, higher y_max.LV, and smaller α. On linear regression analysis to express y_max.LV in terms of CH, the constant (y-intercept) γ was larger although the slope of β did not significantly differ.
The difference between the estimated and reference x_max.LV and y_max.LV did not significantly differ from that of the previous study. However, all the distances from P_max.LV (CT_reference) to P_max.LV (estimated), P_max.LV (averaged), and P_guidelines were larger than those revealed in the previous study based on chest_PA, with the exception of P_guideline (top).

DISCUSSION

This study revealed that the theoretical P_max.LV could be located with parameters easily measurable on chest_AP. We derived and validated its estimating rule as follows: x_max.LV=0.643*CD-RB and y_max.LV=55–0.390*CH (mm). For P_max.LV (CT_reference), this P_max.LV (estimated) was as close as P_max.LV (averaged) and closer than any of the three P_guidelines.
To our knowledge, this is the first study to estimate the theoretical P_max.LV using parameters measured on chest_AP. If the clinical effectiveness and safety of this estimation rule is verified in actual CPR, this rule in addition to that using chest_PA might help clinicians locate P_max.LV. Additionally, it might assist in guiding personalized optimum chest compression in up to 60% of OHCA and 100% of IHCA patients with easily available radiography which would have been checked using either chest_PA or chest_AP prior to CA.
Due to its similar study design, this study enhances the merits of the one previously conducted [12]. First, if the effectiveness and safety of its application to actual CA victims is verified clinically in further studies, these rules may be incorporated into the electronic health record system and mobile applications to enhance the estimation of P_max.LV in advance to guide CPR. Prenotification to the receiving hospital by ambulance personnel delivering OHCA victims and anticipative identification of the inpatients with high risk for IHCA would facilitate this process [20]. Second, by locating personalized P_max.LV using plain chest radiography, researchers could investigate whether better outcomes (return of spontaneous circulation, survival to discharge, and good neurological outcomes) were associated with the closer compression of the theoretical P_max.LV during CPR. This is supposed to be located just above the point where the LV is at its maximum diameter [3-10]. Third, compared with P_max.LV (averaged), P_max.LV (estimated) did not differ in its closeness to P_max.LV (CT_reference). However, its wide range means better flexibility to reflect the actual P_max.LV (CT_reference) compared with the fixed P_max.LV (averaged), the coordinate of which is (52 mm, 11 mm). Moreover, it showed superiority over the three P_guidelines, which represent the current guidelines. Lastly, as both chest_AP and CT were performed in the supine position, the doubt raised in the previous study because of chest_PA being performed in the standing position may be diminished.
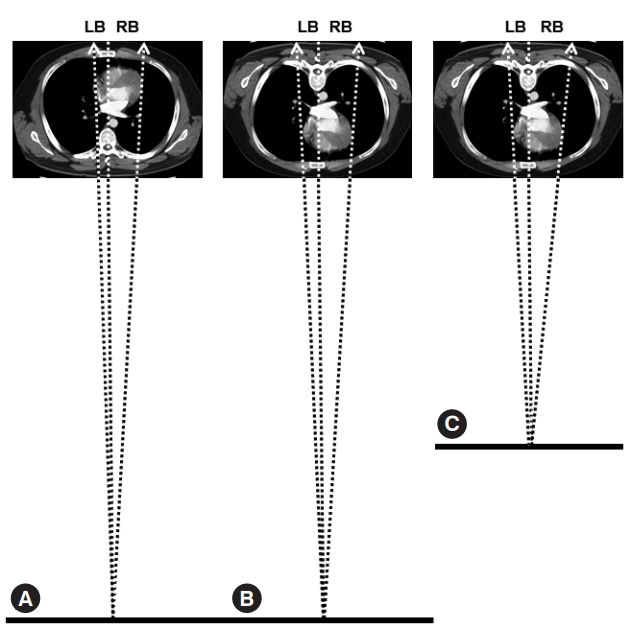
This study showed some differences compared with the previous one, which were not confined to demographic differences that we could not control for (Table 2). First, the population of the study showed smaller CH and higher y_max.LV. When expressing y_max.LV in terms of CH, the constant (y-intercept) γ was larger although the slope of β did not differ. This can be explained by the technical differences in chest_PA and chest_AP (Fig. 3) [12]. When taking a chest_PA, the patient is required to stand up and take a full, deep breath. Therefore, the heart, and thus y_max.LV, would be pulled down by gravity and the fully inflated lungs would depress both the heart and diaphragm resulting in a far lower y_max.LV and a larger CH, respectively (Fig. 3B) [12]. Then, the reverse would remain true: a chest_AP would cause a higher y_max.LV and a smaller CH. We were not able to find references to explain the smaller α in the current study. We hypothesize that this might be related to the altered heart-lung spatial relationship, such as torsion, which depends on the patient’s position and breathing phase, which are the key differences between a chest_PA and a chest_AP. Second, compared with the previous study performed using chest_PA, the population of this study using chest_AP revealed larger CD and RB. This may be explained also by the technical differences in chest_PA and chest_AP (Fig. 4) [21]. In contrast to chest_PA, which is obtained at a fixed distance of 180 cm with the heart located posteriorly, chest_AP is obtained at shorter and variable distances with the heart located anteriorly. Besides the derivation and validation set, we collected a convenience sample of 30 patients to perform a chest_AP in the emergency department. Among these, the mean distance of the radiation was 122±7 cm, ranging from 110 to 132 cm. During chest_ AP, the radiation beam meets the heart at a shorter distance resulting in a larger image of the heart and thus larger CD and RB on the receiving plate for the same patient (Fig. 4) [21].
Initially, we expected that the applicability of the rule to estimate P_max.LV would rise from 71% and 38% to 100% and 60% for IHCA and OHCA, respectively, if P_max.LV became estimable using the previously investigated chest_AP and/or chest_PA. However, we excluded 79 (16.4%) cases among the 482 eligible patients for unmeasurable variables in either chest_AP or CT, thus falling short of that expectation. We think that P_max.LV (averaged) could be used to guide CPR when the estimation rules are not applicable. However, it remains unclear which P_max.LV (averaged) should be adopted; (i.e., the range determined in the previous study [50 mm, -7 mm] or that of the current study [52 mm, 11 mm]).
Comparing the previous study to the current one, x_max.LV was almost the same (50 vs. 52 mm); however, the y_max.LV differed (-7 vs. 10 mm). Both P_max.LVs have been defined on CT, the reference, rather than on chest_PA or chest_AP. Therefore, the difference in y_max.LV would result from the different phase of respiratory cycle during CT rather than the caudal cardiac movement due to the pull of gravity. In the previous study, patients underwent chest_PA; thus, they must have breathed fully during CT. However, those in the current study underwent chest_AP instead of the standard chest_PA, meaning that most of them could not have breathed fully holding their breaths at the end of full inspiration during CT. Their respiratory cycle might have resided even on the expiration phase. The difference in the y_max.LV can be explained by the fact that the LV might move cephalad up to 5 cm at the end of full expiration [22]. However, it remains unclear which estimate of the theoretical optimum chest compression point should be applied; 40–0.356*CH (mm) of the previous study measured at the end of full inspiration or 55-0.390*CH (mm) of the current study for those who could not control their breaths.
We think the actual y_max.LV should be determined considering the phase (whether inspiratory or expiratory) of the respiratory cycle during CPR [23,24]. During basic life support (BLS), the successive, uninterrupted 30 compressions after two rescue breaths would shift the lung-to-heart spatial relationship toward the expiratory phase as it lacks in positive-pressure ventilation during chest compression favoring the y_max.LV of the current study. During advanced cardiac life support (ACLS), compression and positive-pressure ventilation via advanced airways are performed asynchronously. As the lung-to-heart spatial relationship will alter throughout the whole respiratory cycle, the y_max.LV might be determined as the one at the mean phase of cardiac movement of the cycle. In a preliminary study performed among 17 CA victims without return of spontaneous circulation despite 30 min of CPR, it was reported that compressing the lowest section of the sternum, thus supporting a lower y_max.LV representing the inspiration phase, might result in a higher peak arterial pressure and end-tidal carbon dioxide [25]. Large-scale clinical studies to enroll CA victims at the scene are needed to clarify the y_max.LV, which if compressed will lead to better clinical outcomes for BLS and ACLS separately, considering the cardiac movement in the respiratory cycle.
This study shares some similar limitations with the one previously conducted [12]. First, CPR was performed throughout the respiratory cycle from the full inspiration by rescue breath to the passive expiration. Some researchers reported that the LV might move cephalad up to 5 cm at the end of full expiration to emphasize the influence of the respiratory phase on the y_max.LV during CPR [22]. However, we cannot control and specify the phase during the entire respiratory cycle when patients undergo chest_AP instead of the standard chest_PA because they usually cannot stand alone or breathe in fully. Regarding the dyssynchrony between chest_AP and CT, we believe it might be limited as we enrolled cases who had these performed within 1 hour of each other. Second, some researchers showed that the LV of pigs in CA moved leftward during BLS and then rightward during ACLS with a maximum deviation <1 cm from the baseline [26]. We could not measure the lateral deviation of P_max.LV in this study as we used static images of the cases without CA.
In conclusion, personalized theoretical P_max.LV, which does not differ from its averaged location and is superior to the locations recommended by current CPR guidelines, may be located with parameters easily measurable on chest_AP. Further clinical studies are needed to verify its effectiveness and safety in addition to modifying its coordinates considering the cardiac movement during CPR by the altering lung-to-heart spatial relationship.

NOTES

No potential conflict of interest relevant to this article was reported.

REFERENCES

1. Kleinman ME, Brennan EE, Goldberger ZD, et al. Part 5: Adult basic life support and cardiopulmonary resuscitation quality: 2015 American Heart Association Guidelines Update for Cardiopulmonary Resuscitation and Emergency Cardiovascular Care. Circulation 2015; 132:S414-35.
crossref pmid
2. Perkins GD, Handley AJ, Koster RW, et al. European Resuscitation Council Guidelines for Resuscitation 2015: Section 2. Adult basic life support and automated external defibrillation. Resuscitation 2015; 95:81-99.
crossref pmid
3. Hwang K, Chon SB, Im JG. The optimum chest compression site with regard to heart failure demonstrated by computed tomography. Am J Emerg Med 2017; 35:1899-906.
crossref pmid
4. Shin J, Rhee JE, Kim K. Is the inter-nipple line the correct hand position for effective chest compression in adult cardiopulmonary resuscitation? Resuscitation 2007; 75:305-10.
crossref pmid
5. Hwang SO, Zhao PG, Choi HJ, et al. Compression of the left ventricular outflow tract during cardiopulmonary resuscitation. Acad Emerg Med 2009; 16:928-33.
crossref pmid
6. Pickard A, Darby M, Soar J. Radiological assessment of the adult chest: implications for chest compressions. Resuscitation 2006; 71:387-90.
crossref pmid
7. Anderson KL, Castaneda MG, Boudreau SM, Sharon DJ, Bebarta VS. Left ventricular compressions improve hemodynamics in a swine model of out-of-hospital cardiac arrest. Prehosp Emerg Care 2017; 21:272-80.
crossref pmid
8. Klouche K, Weil MH, Sun S, Tang W, Povoas H, Bisera J. Stroke volumes generated by precordial compression during cardiac resuscitation. Crit Care Med 2002; 30:2626-31.
crossref pmid
9. Halperin HR, Lee K, Zviman M, et al. Outcomes from low versus high-flow cardiopulmonary resuscitation in a swine model of cardiac arrest. Am J Emerg Med 2010; 28:195-202.
crossref pmid
10. Nestaas S, Stensaeth KH, Rosseland V, Kramer-Johansen J. Radiological assessment of chest compression point and achievable compression depth in cardiac patients. Scand J Trauma Resusc Emerg Med 2016; 24:54.
crossref pmid pmc
11. Park M, Oh WS, Chon SB, Cho S. Optimum chest compression point for cardiopulmonary resuscitation in children revisited using a 3D coordinate system imposed on CT: a retrospective, cross-sectional study. Pediatr Crit Care Med 2018; 19:e576-84.
crossref pmid
12. Cho S, Oh WS, Chon SB, Kim S, Hwang K. Theoretical personalized optimum chest compression point can be determined using posteroanterior chest radiography. Resuscitation 2018; 128:97-105.
crossref pmid
13. Mangion K, Gao H, Husmeier D, Luo X, Berry C. Advances in computational modelling for personalised medicine after myocardial infarction. Heart 2018; 104:550-7.
crossref pmid
14. van der Bijl P, Delgado V, Bax JJ. Sudden cardiac death: the role of imaging. Int J Cardiol 2017; 237:15-8.
crossref pmid
15. Larkin GL, Copes WS, Nathanson BH, Kaye W. Pre-resuscitation factors associated with mortality in 49,130 cases of in-hospital cardiac arrest: a report from the National Registry for Cardiopulmonary Resuscitation. Resuscitation 2010; 81:302-11.
crossref pmid
16. Girotra S, Nallamothu BK, Spertus JA, et al. Trends in survival after in-hospital cardiac arrest. N Engl J Med 2012; 367:1912-20.
crossref pmid pmc
17. Ramakrishna H, O’Hare M, Mookadam F, Gutsche JT, Shah R, Augoustides JG. Sudden cardiac death and disorders of the QT interval: anesthetic implications and focus on perioperative management. J Cardiothorac Vasc Anesth 2015; 29:1723-33.
crossref pmid
18. Frost J. How to compare regression slopes [Internet]. [place unknown]: Minitab; 2016 [cited 2018 Jan 17]. Available from: http://blog.minitab.com/blog/adventures-in-statistics-2/how-to-compare-regression-lines-between-different-models.

19. Hulley SB, Cummings SR, Browner WS, Grady D, Newman TB. Designing clinical research. Philadelphia, PA: Wolters Kluwer/Lippincott Williams & Wilkins; 2013.

20. Deakin CD, England S, Diffey D. Ambulance telephone triage using ‘NHS Pathways’ to identify adult cardiac arrest. Heart 2017; 103:738-44.
crossref
21. Chon SB, Oh WS, Cho JH, Kim SS, Lee SJ. Calculation of the cardiothoracic ratio from portable anteroposterior chest radiography. J Korean Med Sci 2011; 26:1446-53.
crossref pmid pmc
22. Kwon H, Kim Y, Kim K, et al. Where is the left ventricle during cardiopulmonary resuscitation based on chest computed tomography in the expiration with arms down position? PLoS One 2018; 13:e0193364.
crossref pmid pmc
23. Song C, Yang Y, Qi W, Wernick MN, Pretorius PH, King MA. Motion-compensated image reconstruction vs postreconstruction correction in respiratory-binned SPECT with standard and reduced-dose acquisitions. Med Phys 2018; 45:2991-3000.
crossref pmid pmc
24. Feng T, Wang J, Tsui BM. Dual respiratory and cardiac motion estimation in PET imaging: methods design and quantitative evaluation. Med Phys 2018; 45:1481-90.
crossref pmid
25. Cha KC, Kim HJ, Shin HJ, Kim H, Lee KH, Hwang SO. Hemodynamic effect of external chest compressions at the lower end of the sternum in cardiac arrest patients. J Emerg Med 2013; 44:691-7.
crossref pmid
26. Jung YH, Jeung KW, Lee DH, et al. Relationship between left ventricle position and haemodynamic parameters during cardiopulmonary resuscitation in a pig model. Heart Lung Circ 2018; 27:1489-97.
crossref pmid

Fig. 1.
Identification of anatomical parameters on anteroposterior chest radiography, the zero point, and the theoretical optimum chest compression point. (A) Definition of anatomical parameters on anteroposterior chest radiography. Three vertical lines are drawn (white solid ones). The midline starts from the spinous process of the highest visible cervical vertebra and ends at the midpoint between the pedicles of the lowest visible thoracic vertebra. Its x coordinate is defined as zero. Then two parallel lines are drawn, which touch the right and left cardiac borders tangentially. The cardiac diameter (CD) is defined as the distance between these two lines. The distance from the midline to the line touching the right cardiac border is designated as RB. Thereafter, two horizontal lines (black dotted ones) are drawn. The upper one touches the bottom of the carina, where the lowest surfaces of the two main bronchi meet. The lower line contains the uppermost point of the left hemi-diaphragm. The distance between these two horizontal lines is designated as the cardiac height (CH). (B) Clinical and (C) radiographic identification of the zero point (P_zero). The midpoint of the xiphisternal joint, where both the costal margins, sternal body, and xiphoid process meet, has been selected as the P_zero with its own coordinate of (0, 0, 0). From P_zero, horizontal, vertical, and into-the-thoracic vertical lines, which form right angles with one another, were drawn as x, y and z axes, respectively. Leftward, upward, and into-the-thorax directions were designated as positive. (D) Identification of the theoretical optimum chest compression point on computed tomography (P_max.LV [CT_reference]). First, the midpoint of the left ventricle (LV), where the LV shows its maximum diameter, is identified by navigating through the sagittal sections of computed tomography (See Fig. 1C). Its 3-dimensional coordinate (x_max.LV, y_max.LV, z_max.LV) is determined using the intrinsic gauging function of the picture archiving and communication system. Then, P_max.LV (CT_reference) is defined as the point where the vertical line originating from P_max.LV meets the anterior chest surface. The 3-dimensional coordinate of P_max.LV (CT_reference) becomes (x_max.LV, y_max.LV, 0). Dotted ellipses: proximal end of the main bronchi; triangle: the bottom of the carina; diamond: the uppermost point of the left hemi-diaphragm; rectangle: P_zero; star: P_max.LV; circle: midpoint of the LV at its maximum diameter. Adapted from Cho S et al. Resuscitation 2018;128:97-105, with permission from Elsevier [12].
ceem-19-016f1.jpg
Fig. 2.
Location of estimated and averaged theoretical optimum chest compression points and three representative points recommended by current cardiopulmonary resuscitation guidelines to demonstrate their closeness to the reference theoretical optimum chest compression point identified on computed tomography (CT). The estimated P_max.LV (P_max.LV [estimated]) was validated in two ways. First, to check its precision, its x and y coordinates were compared with those of P_max.LV (CT_reference), the reference values measured on CT. Secondly, we assessed its superiority over the other candidate compression points by showing how close it is to P_max.LV (CT_reference). We compared its distance to P_max.LV (CT_reference) (white double-headed solid arrow) with the distance from P_max.LV (CT_reference) (1) to the averaged P_max.LV (P_max.LV [averaged]), which was defined by the averaged value of the x and y coordinates for the study population (white double-headed dashed arrow) and (2) to three points representing the lower sternal half where the current cardiopulmonary resuscitation guidelines recommend to compress (black double headed solid arrows): P_guideline (top), P_guideline (middle), and P_guideline (bottom). These three P_guidelines were identified along the vertical midline of the lower sternal half at equal distances designated as top, middle, and bottom with their y coordinates: y_guideline (top), y_guideline (middle), and y_guideline (bottom), which equals y_sternum (bottom), respectively. By designating the uppermost and lowest y coordinate of the whole sternum as y_sternum (top) and y_sternum (bottom), respectively, we could calculate y_guideline (top) and y_guideline (middle) as ‘y_sternum (bottom)+(whole sternal length)/2’ and ‘y_sternum (bottom)+(whole sternal length)/4’, where ‘whole sternal length’ equals ‘y_sternum (top)-y_sternum (bottom).’ Rectangle: P_zero; star: P_max.LV (CT_reference); cross: P_max.LV (estimated); white circle: P_max.LV (averaged); black circles: P_guidelines (top, middle, and bottom); ①–⑤: distances from P_max.LV (CT_reference) to P_max.LV (estimated) (①), P_max.LV (averaged) (②), P_guideline (top) (③), P_guideline (middle) (④) and P_guideline (bottom) (⑤). Adapted from Cho S et al. Resuscitation 2018;128:97-105, with permission from Elsevier [12].
ceem-19-016f2.jpg
Fig. 3.
Estimation of the theoretical optimum chest compression point from anteroposterior and posteroanterior chest radiography and the difference in cardiac height (CH) and y_max.LV rooted in their technical differences. (A) Estimation of the theoretical optimum chest compression point from anteroposterior chest radiography (chest_AP). (B) Estimation of the theoretical optimum chest compression point from posteroanterior chest radiography (chest_PA) and the difference in its CH and y_max.LV from that of anteroposterior chest radiography caused by its technical differences. When undergoing chest_PA, patients stand up and breathe in to the fullest extent. As they stand up, their heart with its y_max.LV is pulled downward by gravity and the diaphragm is also pushed downward. As they breathe in fully, the lungs inflate to the maximum capacity and push the diaphragm caudally again. These technical differences in chest_PA cause larger CH and lower y_max.LV than those caused by technical differences in chest_AP, which is taken with the critically ill patient usually in a supine position without complete control of the respiratory cycle. CD, cardiac diameter; RB, right cardiac border. Dotted ellipses: proximal end of the main bronchi; triangle: the bottom of the carina; diamond: the uppermost point of the left hemi-diaphragm; star: P_max.LV; circles: the right and left cardiac borders the vertical tangential lines meet the heart; rectangle: P_zero. Adapted from Cho S et al. Resuscitation 2018;128:97-105, with permission from Elsevier [12].
ceem-19-016f3.jpg
Fig. 4.
Reasons for the difference in the right (RB) and left (LB) cardiac border and the cardiac diameter (CD), which is the sum of RB and LB, when measured on anteroposterior chest radiography (chest_AP) compared with those measured on posteroanterior chest radiography (chest_PA) demonstrated by simulating both techniques using an image obtained via computed tomography. (A) Simulation of chest_PA. The radiation beam, which starts 180 cm away from the receiving plate, meets the heart located posteriorly. (B) Simulation of chest_AP (1). The radiation beam meets the heart being located anteriorly within the thorax and causes a larger image of the heart and thus a larger RB and CD on the receiving plate than those of chest_PA. (C) Simulation of chest_AP (2). The radiation beam travels a variable but consistently shorter distance from the source to the receiving plate than that in chest_PA: 122±7 ranging from 110–132 cm, which is definitely shorter than 180 cm, the fixed distance to perform chest_PA. Therefore, it causes a larger cardiac image, RB, and CD again on the receiving plate compared with those of chest_PA. Dotted arrows: radiation beam to the right and left cardiac borders; Dotted line: reference line to define x=0; Thick baseline: the bottom line to which the source of the radiation beam belongs. For easy explanation, the points the radiation beam meets on the right and left cardiac borders have been assumed to lie on the same plane. Adapted from Chon SB et al. J Korean Med Sci 2011;26:1446-53, with permission from Korean Academy of Medical Sciences [21].
ceem-19-016f4.jpg
Table 1.
Demographic and radiographic characteristics of derivation and validation sets
Information Derivation (n=237) Validation (n=123) P-value Total (n=360)
Demographics
 Female, n (%) 68 (28.7) 34 (27.6) 0.83 102 (28.3)
 Age (yr) 51.8 ± 17.5 52.6 ± 19.7 0.72 52.0 ± 18.3
 Height (cm) 166.5 ± 8.8 166.1 ± 8.0 0.70 166.3 ± 8.5
 Weight (kg) 66.1 ± 13.4 63.8 ± 10.7 0.089 65.3 ± 12.6
 BMI (kg/m2) 23.7 ± 3.8 23.0 ± 3.1 0.077 23.5 ± 3.6
Chest_AP (mm)
 CD 156 ± 17 154 ± 19 0.277 155 ± 18
 RB 48 ± 12 46 ± 11 0.10 48 ± 12
 CH 114 ± 18 117 ± 18 0.13 116 ± 18
Chest CT (mm)
 y_sternal top 142 ± 15 141 ± 14 0.59 142 ± 15
 y_sternal bottom -43 ± 12 -44 ± 13 0.87 -43 ± 12
 x_max. LV 52 ± 10 52 ± 10 0.89 52 ± 10
 y_max. LV 11 ± 20 9 ± 20 0.36 10 ± 20
Derived constants
 α 0.643 ± 0.073 NA NA 0.643 ± 0.080
 β (95% CI) -0.425 (-0.556, -0.294) NA NA -0.390 (-0.498, -0.282)
 γ (95% CI) 60 (45, 75) NA NA 55 (43, 68)
Estimated value minus CT_reference value (mm)a)
 x_max.LV NA 1 ± 13 NA 0 ± 12
 y_max.LV NA 1 ± 19 NA 0 ± 18
Distance from P_max.LV (CT_reference) to (mm)a)
 P_max.LV (estimated) NA 20 ± 11 NA 19 ± 11
 P_max.LV (averaged) NA 19 ± 11 0.13b) 19 ± 11
 P_guideline (top) NA 67 ± 13 < 0.001b) 67 ± 13
 P_guideline (middle) NA 56 ± 11 < 0.001b) 56 ± 10
 P_guideline (bottom) NA 76 ± 18 < 0.001b) 77 ± 17

BMI, body mass index; AP, anteroposterior; CD, cardiac diameter; RB, the distance from the thoracic midline to the parallel line touching the right cardiac border tangentially; CH, cardiac height; CT, computed tomography; LV, left ventricle; NA, not available; CI, confidence interval; CT_reference value, reference values measured on CT; P_max.LV, the point compression of which is presumed to maximize the stroke volume of the left ventricle with its coordinate of (x_max.LV, y_max.LV, 0); P_guideline, the points along the lower sternal half with (top) at its top, (middle) at its middle and (bottom) at its bottom, respectively; x_‘A’, x coordinate of point ‘A’; y_‘A’, y coordinate of point ‘A.’

a) For comparison within the validation set, the coordinate of P_max.LV (estimated), P_max.LV (averaged), P_guideline (top), P_guideline (middle) and P_guideline (bottom) were designated as follows using α0, β0, and γ0 calculated from the derivation set: (0.643*CD-RB, 60-0.425*CH), (52, 11), (0, y_sternal bottom+sternal length/2), (0, y_sternal bottom+sternal length/4) and (0, y_sternal bottom), respectively (where, sternal length=y_sternal top-y_sternal bottom). For comparison within the total cases, P_max.LV (estimated) were located at (0.643*CD-RB, 55-0.390*CH) using the new α0, β0, and γ0 derived from the combined set. P_max.LV (averaged) was set at (52, 10), accordingly, while the three P_guidelines were defined in the same way as above.

b) Compared with the distance from P_max.LV (CT_reference) to P_max.LV (estimated) by paired t-test.

Table 2.
Comorbidity and structural abnormality of derivation and validation sets
Status Derivation (n = 237) Validation (n = 123) P-value Total (n = 360)
Comorbidity, n (%)
 Hypertension 36 (15.2) 27 (22.0) 0.11 63 (17.5)
 Diabetes mellitus 26 (11.0) 10 (8.1) 0.39 36 (10.0)
 Hyperlipidemia 3 (1.3) 3 (2.4) 0.42 6 (1.7)
 Ischemic heart disease 6 (2.5) 3 (2.4) > 0.99 9 (2.5)
 Heart failure 2 (0.8) 0 (0.0) 0.55 2 (0.6)
 Obstructive lung disease 5 (2.1) 2 (1.6) > 0.99 7 (1.9)
 Restrictive lung disease 0 (0.0) 0 (0.0) NA 0 (0.0)
 Pulmonary embolism 3 (1.3) 1 (0.8) > 0.99 4 (1.1)
 Chronic kidney disease 4 (1.7) 2 (1.6) > 0.99 6 (1.7)
 Chronic liver disease 3 (1.3) 3 (2.4) 0.42 6 (1.7)
 Stroke 9 (3.8) 10 (8.1) 0.081 19 (5.3)
 Malignancy 7 (3.0) 7 (5.7) 0.25 14 (3.9)
Structural abnormality, n (%)
 Hemo-/pneumothorax > 1-cm depth 17 (7.2) 9 (7.3) 0.96 26 (7.2)
 Atelectasis/lobectomy 11 (4.6) 5 (4.1) 0.80 16 (4.4)
 Pleural effusion/empyema > 2-cm depth 8 (3.4) 6 (4.9) 0.57 14 (3.9)
 Wide mediastinum 6 (2.5) 2 (1.6) 0.72 8 (2.2)
 Aortic dissection 4 (1.7) 0 (0.0) 0.30 4 (1.1)

NA, not available.

Table 3.
Intra-class correlation coefficient to measure key variables on anteroposterior chest radiography and computed tomography
Variable Intra-class correlation coefficient P-value
On anteroposterior chest radiography
 Cardiac diameter 0.98 < 0.001
 Right cardiac border 0.98 < 0.001
 Cardiac height 0.99 < 0.001
On computed tomography
 x_max.LV 0.98 < 0.001
 y_max.LV 0.97 < 0.001
 y_sternum (top) 0.97 < 0.001
 y_sternum (bottom) 0.96 < 0.001

LV, left ventricle.

Table 4.
Comparison with the previous study which aimed to estimate the theoretical optimum chest compression point using chest_PA
Information Previous study performed with chest_PA (n=266) Current study performed with chest_AP (n=360) P-value
Demographics
 Female, n (%) 120 (45.1) 102 (28.3) < 0.001**
 Age (yr) 57.6 ± 16.4 52.0 ± 18.3 < 0.001**
 Height (cm) 162.6 ± 8.7 166.3 ± 8.5 < 0.001**
 Weight (kg) 60.9 ± 10.9 65.3 ± 12.6 < 0.001**
 BMI (kg/m2) 23.0 ± 3.7 23.5 ± 3.6 0.092
Chest X-ray (mm)
 CD 142 ± 18 155 ± 18 < 0.001**
 RB 44 ± 11 48 ± 12 < 0.001**
 CH 131 ± 20 116 ± 18 < 0.001**
Chest CT (mm)
 y_sternal top 139 ± 15 142 ± 15 0.024*
 y_sternal bottom -42 ± 11 -43 ± 12 0.084
 x_max.LV 50 ± 10 52 ± 10 0.067
 y_max.LV -7 ± 17 10 ± 20 < 0.001**
Derived constants
 α 0.664 ± 0.069 0.643 ± 0.080 < 0.001**
 β (95% CI) -0.356 (-0.446, -0.266) -0.390 (-0.498, -0.282) 0.64
 γ (95% CI) 40 (28, 51) 55 (43, 68) < 0.001**
Estimated value minus CT_reference value (mm)
 x_max.LV 0 ± 10 0 ± 12 0.93
 y_max.LV 0 ± 15 0 ± 18 0.73
Distance from P_max.LV (CT_reference) to (mm)
 P_max.LV (estimated) 15 ± 9 19 ± 11 < 0.001**
 P_max.LV (averaged) 17 ± 10 19 ± 11 0.014*
 P_guideline (top) 76 ± 13 67 ± 13 < 0.001**
 P_guideline (middle) 54 ± 11 56 ± 10 0.027*
 P_guideline (bottom) 63 ± 13 77 ± 17 < 0.001**

chest_PA, posteroanterior chest radiography; chest_AP, anteroposterior chest radiography; BMI, body mass index; CD, cardiac diameter; RB, the distance from the thoracic midline to the parallel line touching the right cardiac border tangentially; CH, cardiac height; CT, computed tomography; LV, left ventricle; CI, confidence interval; CT_reference value, reference values measured on CT; P_guideline, the points along the lower sternal half with (top) at its top, (middle) at its middle and (bottom) at its bottom, respectively; P_max.LV, the point compression of which is presumed to maximize the stroke volume of the left ventricle with its coordinate of (x_max.LV, y_max.LV, 0); x_‘A’, x coordinate of point ‘A’; y_‘A’, y coordinate of point ‘A.’ Data on the left column have been retrieved from Cho S et al. Resuscitation 2018;128:97-105.12.

* P<0.05,

** P<0.01.

Editorial Office
The Korean Society of Emergency Medicine
101-3104, Brownstone Seoul, 464 Cheongpa-ro, Jung-gu, Seoul 04510, Korea
TEL: +82-31-709-0918   E-mail: office@ceemjournal.org
About |  Browse Articles |  Current Issue |  For Authors and Reviewers
Copyright © by The Korean Society of Emergency Medicine.                 Developed in M2PI