


INTRODUCTION
The electrocardiogram (ECG) is a fundamental test assessing the cardiovascular system of patients by detecting the heartbeat and electrical signals that spread across the cardiac muscle. ECG has been widely used for the diagnosis and management of cardiovascular diseases.
Twelve leads in ECG can assess the three-dimensional heart structure and offer cardiac muscle status by reading the potential and conduction velocity of electrical signals. The 12 lead-guided ECG machine also simultaneously provides ECG images and automatic interpretation. The automatic interpretation is generated by measuring time intervals (PP interval, PR interval, QRS interval, ST interval, and QT interval) or identifying the characteristics of specific waves or points (P wave, QRS wave, T wave, and J point) [1].
The high diagnostic accuracy of the automatic ECG interpretation can be clinically beneficial in deciding emergent percutaneous coronary intervention (PCI) for ST-segment elevation myocardial infarction (STEMI) [2,3]. However, the automatic ECG interpretation can also be inaccurate and should be confirmed by physicians. Mawri et al. [4] reported that the automatic ECG interpretation was inaccurate in 102 of 340 patients (30%) with STEMI. In another study, the automatic interpretation in 12-lead ECGs demonstrated wide variations in false positive (overdiagnosis in 0%–42%) and false negative results (underdiagnosis in 22%–42%) for STEMI diagnosis. 1 We suspected that the characteristics of the culprit artery, such as the number and sort, might affect the diagnostic accuracy of the automatic ECG interpretation in patients with STEMI.
This study aimed to analyze the association between the culprit artery and the diagnostic accuracy of the automatic ECG interpretation in patients with STEMI.
METHODS
Study design and setting
This was a single-centered, retrospective cohort study. We obtained data from electronic medical records of the emergency department of a university-affiliated, tertiary care, urban hospital in South Korea with an annual census of approximately 40,000 patients. This study was approved by the institutional review board of Hallym University Kangnam Sacred Heart Hospital (HKS 2021-01-008) with a waiver of informed consent.
Study paricipants
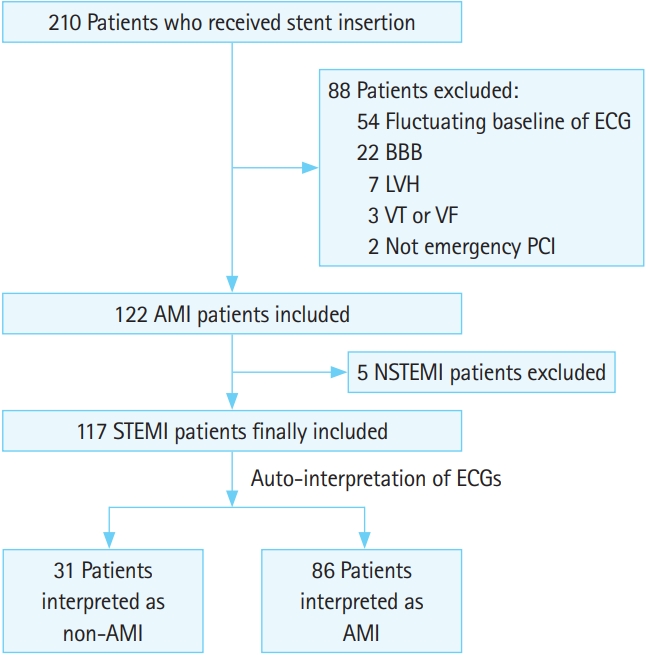
We included patients who met all following criteria: patients who visited the emergency department for acute chest pain between January 2017 and December 2020; patients who were diagnosed with acute myocardial infarction (AMI) by ICD-10 (International Classification of Diseases 10th edition) code (I21.9); patients who emergently received more than one stent insertion for culprit arteries via PCI; and patients who met the STEMI diagnostic criteria on ECG [5].
We excluded patients who met any of the following criteria: age ≤ 18 years; non-STEMI on the ECG; poor quality of ECGs, such as a wandering baseline; the ECG hindering STEMI diagnosis, such as the bundle branch block, left ventricle hypertrophy, ventricular tachycardia, and ventricular fibrillation; elective PCI; emergent PCI without stent insertion for a total occlusion of the culprit artery; and an emergent PCI, in which balloon angioplasty only was performed without stent insertion.
Data collection
The baseline characteristics of patients, such as sex, age, underlying diseases, past history and medications, the time interval for ECG application, laboratory findings, and patient outcomes, were collected from the electronic medical records.
A single ECG machine (MAC 5500 HD; GE Healthcare, Milwaukee, WI, USA) has been used in the emergency room during the study period. A culprit coronary artery was defined as any vessel with an acute thrombotic total or subtotal occlusion [6]. The STEMI on ECG was confirmed by a cardiologist. The STEMI-ECGs were categorized into three groups according to the sort of culprit artery receiving a coronary intervention. The culprit arteries were the left anterior descending artery (LAD), left circumflex artery (LCX), and right coronary artery (RCA). We also collected the results of the auto-interpretation of the ECG machine between non-AMI vs. AMI for patients with STEMI. The ST-segment changes of the ECG were identified by the three following findings: no specific ST-segment change, ST-segment elevation, and reciprocal ST depression. Additionally, the involved 12 leads by culprit artery occlusion were grouped according to four locations of infarction: anteroseptal (V1-4 associated with LAD occlusion); lateral (I, aVL, V5-6 associated with LCX occlusion); inferior (II, III, aVF associated with RCA, LCX, or LAD occlusion); and aVR (associated with left main coronary artery or proximal LAD occlusion).
Endpoints
The primary endpoint was the correlation between the culprit artery occlusion and the misinterpretation of ECG,
Statistical analysis
Data were compiled using a standard spreadsheet application (Excel; Microsoft, Redmond, WA, USA) and analyzed using the IBM SPSS Statistics ver. 26.0 (IBM Corp., Armonk, NY, USA). We generated descriptive statistics and presented them as frequencies and percentages for categorical variables. Continuous variables were presented as mean with standard deviation for parametric data or median with interquartile range for nonparametric data. The normality for continuous variables was tested by the Shapiro-Wilk test. To identify the correlation between factors and auto-interpretation of ECG, the chi-square test or Fisher exact test was used for categorical variables. Independent t-test (parametric data) or Mann-Whitney test (nonparametric data) was used for continuous variables. For all analyzed data, statistical significance was set at a P-value < 0.05.
RESULTS
There were 210 adult patients who received stent insertion. Finally, 117 patients with STEMI were included after excluding patients who met with exclusion criteria. According to the result of the auto-interpretation of ECG, we divided the two comparative groups, the non-AMI (inaccurate interpretation) and AMI (accurate interpretation) groups, for analysis (Fig. 1).
Baseline characteristics
We compared the following factors between the non-AMI and AMI groups by the automatic interpretation of ECG: sex, age, underlying diseases, past history and medication, the time interval for ECG application, laboratory findings, and patient outcomes. In all analyses for several factors of patients with STEMI, there was no statistical significance between the non-AMI and AMI groups, as shown in Table 1 (P > 0.05). The diagnostic accuracy of auto-interpretation was 73.5% (86 AMI interpretation of 117 patients with STEMI). In total, 26.5% of patients with STEMI were inaccurately interpreted as non-AMI by the auto-interpretation of the ECG machine.
Analysis of inaccurate automatic interpretation of STEMI according to the culprit artery
The correlation between the culprit artery and the auto-interpretation of ECG is analyzed in Table 2. There was no significant correlation of these with the accuracy of auto-interpretation of ECG based on the analysis of the ST segment change in the four involved leads (P > 0.05). In the analysis for the number of culprit arteries (one vs. two or three), one culprit artery significantly affected the inaccuracy of the auto-interpretation of ECG compared with two or three culprit arteries (misinterpretation in one vs. two or three culprit arteries; single vs. multiple; 27/86 [31.3%] vs. 4/31 [12.9%], respectively; P = 0.045). However, in the sort of culprit arteries (LAD, LCX, RCA, LAD-LCX, LAD-RCA, LCX-RCA, and LAD-LCX-RCA), the sort of culprit artery showed no statistical significance for the accuracy of auto-interpretation of ECG (P = 0.132).
Correlation between the inaccurate automatic interpretation and ST-segment change of ECG
To identify the correlation between the number of culprit arteries and inaccuracy of the auto-interpretation of ECG, two ST-segment changes, such as ST-segment elevation and ST depression, were additionally compared in Table 3. Nevertheless, there was no significant association between the ST-segment change and inaccuracy of the auto-interpretation of ECG (P > 0.05).
DISCUSSION
This study demonstrated that the number of culprit arteries might affect the diagnostic accuracy of the automated ECG interpretation. However, the sort of ST-segment change of the culprit artery did not show a significant effect on the accuracy. In patients with STEMI, we also found that the diagnostic accuracy of auto-interpretation was 73.5%, whereas 26.5% were misinterpreted as non-AMI.
Algorithm accuracy may vary according to both the manufacturer’s automated program and the level of the participating ECGs’ over-readers [1]. Age, sex, and race have been known as significant factors to affect algorithm accuracy. The algorithm can misinterpret STEMI as non-AMI if ECG artifacts and nonischemic causes of the ST-segment elevation, such as early repolarization, exist [7,8]. Even experts perform 11% to 14% false-positive interpretations (overdiagnosis) of the ECG for presumed STEMI cases. Nevertheless, the diagnostic accuracy of experts remains higher than that of automatic ECG interpretation [9].
In this study, we only used one ECG auto-interpretation algorithm and the gold standard by an experienced cardiologist. ECG artifacts hindering STEMI diagnosis were also removed. There was no difference regarding population characteristics between misinterpretation in the non-AMI and AMI groups in Table 1. These results suggest that age and sex did not significantly affect the accuracy of the algorithm in this study.
In the analysis regarding culprit artery occlusion, more than two culprit artery occlusions showed significantly lower misinterpretation of STEMI compared to one culprit artery occlusion. Among the various single culprit ateries, only, LAD and RCA occlusion increased misinterpretation of ECG (LAD 45.2% vs. LCX 0% vs. RCA 41.9%). Considering that there was no significant correlation with the sort of culprit artery or ST-segment change, we suspected that other causes, which were not fully analyzed, exist between both groups. For example, the difference of amplitude, concavity of the ST-segment elevation, or prior ECG findings might affect the misinterpretation of STEMI. Otherwise, an unknown confounder could affect the algorithm accuracy unrelated to the ST-segment change. We believe that the auto-interpretation using artificial intelligence can solve these misinterpretation issues by training a broad ECG database [1,10].
This study has some limitations. First, the population size of STEMI was small. The results of this study, including algorithm accuracy, do not represent that of the overall population. Second, the study only considered the “gold standard” by an experienced cardiologist. The consensus of more than two cardiologists can reinforce the reliability of STEMI confirmation. Third, only a single ECG machine (MAC 5500 HD) has been used in this study. The following factors may change the results of the ECG misinterpretation for STEMI: the difference of computed algorithms of the ECG machine and the difference of ECG companies. Finally, we only analyzed the misinterpretation of automatic ECG for patients with STEMI without control groups, such as non-STEMI or normal ECG. Therefore, this study did not suggest the results of generalizing the accuracy of automatic ECG interpretation comparing the control groups.
In summary, the presence of a rate of a single culprit artery occlusion might increase the misinterpretation of the ECG compared with multiple culprit artery occlusions with automatic interpretation of STEMI.