


INTRODUCTION
Pulmonary embolism (PE) is the migration of solid material through the bloodstream to the pulmonary circulation. PE is one of the leading causes of mortality in the USA and Europe, causing approximately 300,000 deaths per year in the USA [1]. PE has a complex pathophysiology: the occlusion of 30% to 50% of the total cross-sectional area of the pulmonary arterial bed causes a significant increase in pulmonary artery pressure and acute right ventricular (RV) afterloads [2]. An acute RV afterload leads to decreased RV and cardiac output, which is potentially responsible for obstructive shock, while pulmonary circulation worsens the exchange of oxygen due to a ventilation-perfusion mismatch [3]. However, the extent of pulmonary arterial bed involvement is highly variable, and the same clot migration could have different effects on pulmonary and systemic circulation depending on each patientŌĆÖs cardiac and pulmonary status. Therefore, the symptoms, clinical signs, and laboratory data can be highly variable, but a timely diagnosis and prognostic assessment are nonetheless essential for correct management of this condition.
The most recent guidelines on PE were published in 2020 by the European Society of Cardiology (ESC) and recommend the use of a diagnostic and therapeutic strategy based on the predicted risk of either PE or short-term mortality. Patients with hemodynamic instability are at higher risk of early mortality, and patients without hemodynamic instability need further risk stratification according to the Pulmonary Embolism Severity Index (PESI) or simplified PESI (sPESI), RV dysfunction on bedside ultrasonography or computed tomography pulmonary angiography (CTPA), and elevated circulating biomarkers of myocardial injury [4]. Although the PESI is one of the best-validated risk scores in PE, it includes 11 items, which makes it unsuitable for a quick calculation at the bedside. Moreover, its use is recommended as a class IIa, level of evidence B, suggesting that there is still conflicting evidence on the accuracy of this score. Vamsidhar et al. [5] demonstrated no difference in PESI scores among patients with and without adverse events. A recent multicenter study [6] showed that PESI and sPESI scores yielded modest results in discriminating 7-day mortality, with an area under the receiver operating characteristic curve (AUROC) ranging from 0.62 to 0.67 and no difference from the ESC prognostic classification. Moreover, the 30-day all-cause mortality risk for PESI and sPESI scores derived from retrospective cohorts and their inconsistency in estimating shorter outcomes limits their clinical utility. Apart from a few exceptions (e.g., Barnes et al. [6]), there is a lack of published studies comparing the prognostic power of different risk scores [7]. Our objective in this study was to develop and validate a new, simple prognostic score for PE and compare its accuracy with that of the PESI, sPESI, and shock index (SI) in predicting all-cause in-hospital mortality (IHM) in an unselected, real-life population of patients admitted to the emergency department (ED) with a diagnosis of PE.
METHODS
Ethical statements
This study was conducted in accordance with the Declaration of Helsinki and approved by the Central Emilia Wide Area Ethical Committee of the Emilia-Romagna Region (CE-AVEC; No. 149/2022/ Oss/AOUFe). Informed consent was waived due to the studyŌĆÖs retrospective nature. The TRIPOD (transparent reporting of a multivariable prediction model for individual prognosis or diagnosis) statement [8] has been followed in preparing this manuscript (Supplementary Material 1).
Study design
This retrospective observational study was conducted in the EDs of two third-level university hospitals, each with more than 80,000 patient visits per year. The two EDs are in very different geographic areas with equally different demographic and sociocultural characteristics: a large, industrialized metropolis of almost 3 million people in central Italy and a city in northern Italy serving an area of 350,000 inhabitants. Both institutions are referral centers for cardiopulmonary emergencies in their respective districts. Clinical data were collected by analyzing the hospital data systems for vital signs, laboratory data, and demographic data. The clinical data used are those presented upon arrival in the ED. All variables are entered into the new model as dichotomous variables; for continuous variables, the best cutoff was identified as the one with the highest Youden index. The already proposed cutoff was maintained unless it differed clinically from the value with the highest Youden index. Platelet count was evaluated as abnormal when it was <100 or >400├Ś103/╬╝L, as already proposed [9]. Different troponin determination techniques have been used over time in the two hospitals with the following normal upper limits: (1) high sensitivity cardiac-Troponin I (hs-cTnI) <20 and <12 ng/L for male and female patients, respectively, in the derivation cohort in the years 2018ŌĆō2021; and (2) hs-cTnI with a normal range of 0.04 ng/mL in the years 2018ŌĆō2020 and hs-cTnI with a normal range of <57 and <37 ng/L for male and female patients, respectively, from May 3, 2020, to December 2021 in the validation cohort. Therefore, we decided to report the troponin levels only as above the normal limit provided by the laboratory for the given determination. Altered mental status was defined as the occurrence of disorientation, lethargy, stupor, or coma upon admission to the ED. PESI and sPESI were calculated for each patient according to the 2019 ESC guidelines on PE [4], and the SI was calculated as heart rate/systolic blood pressure and considered to be positive at values >0.7 (see Table 1 for score calculation).
IHM was reported as all-cause in-hospital death following admission, regardless of the length of in-hospital stay (LoS). The occurrence of IHM and LoS were both evaluated by a second investigator, who checked the information system blinded to other clinical data. IHM was reported as secondary to all causes of inhospital death.
Study patients and enrollment criteria
All patients aged >18 years evaluated in the ED for acute PE as the main diagnosis from January 1, 2018 to May 30, 2021 were included. Patients with PE diagnoses were retrieved using a computerized search of ED discharge codes. The patients whose diagnosis of PE had been made using contrast chest CT were included in the study cohort.
Patients who were pregnant, did not receive a PE diagnosis in the ED, or had an inconsistent or incomplete set of data for calculating the evaluated scores were excluded from the final analysis.
Score derivation
To build a new prognostic score, we randomly chose one ED as the derivation cohort. We performed univariate regression analyses to identify predictors of IHM. Among those predictors, only items identified as independent predictors in the multivariable regression analysis were included in the final logistic model. To assign a value to each of the included variables, we created a simple linear regression model containing all the predictors, and points were attributed to each variable by considering the adjusted standardized coefficients of each item. The model was checked for multicollinearity via variance inflation factor analysis [10]. The internal validity of the score was confirmed using bootstrap analysis [11].
Score validation
ED patients in the other hospital were enrolled as the validation cohort. Clinical charts were retrospectively analyzed to extract the clinical data required to compute the PESI, sPESI, SI, new prognostic score, and IHM. The clinical data were extracted blindly to IHM, and all scores were calculated as reported in Table 1. The calibration and discrimination of the new score were assessed, and its diagnostic accuracy was compared with that of the PESI, sPESI, and SI. A multivariable logistic regression analysis was performed for each score to assess the predictive value of each item in terms of odds ratios (ORs) and 95% confidence interval (CIs).
Statistical analysis
Normally distributed data are described as the mean┬▒standard deviation; non-normally distributed data are described as the median and interquartile range; and categorical data are reported as absolute numbers and percentages. Normally distributed data were compared via independent sample t-testing or Welch t-testing in cases of unequal variance between groups. Non-normally distributed data were compared via the Mann-Whitney U-test. The Pearson chi-square test was used to compare categorical dependent variables among at least two independent groups. Missing data not essential for score calculation were imputed via regression multiple imputation analysis [12].
The discrimination ability of each score was evaluated via the AUROC. The AUROCs of the scores were compared via the DeLong test [13] in the derivation, validation, and global cohorts. The best cutoff was identified according to the highest Youden index [14]. The category-based net reclassification improvement (NRI) was calculated according to Leening et al. [15] to evaluate the difference in risk stratification between the developed score and the PESI and sPESI. The newly developed score was compared to the five risk categories of the PESI (class I, <65; class II, 66ŌĆō85; class III, 86ŌĆō105; class IV, 106ŌĆō125; and class V, >125) according to the ESC 2019 guidelines [4]. The newly developed score was compared to the sPESI by identifying a low-risk class for predicted IHM <5% and a high-risk class for predicted IHM >5%. The event NRI, non-event NRI, and overall NRI are reported for each comparison. Calibration of the developed model was assessed via the Hosmer-Lemeshow test in the derivation and validation groups [16].
Statistical analyses were performed using IBM SPSS ver. 25 (IBM Corp) and MedCalc ver. 17.6 (MedCalc Software).
RESULTS
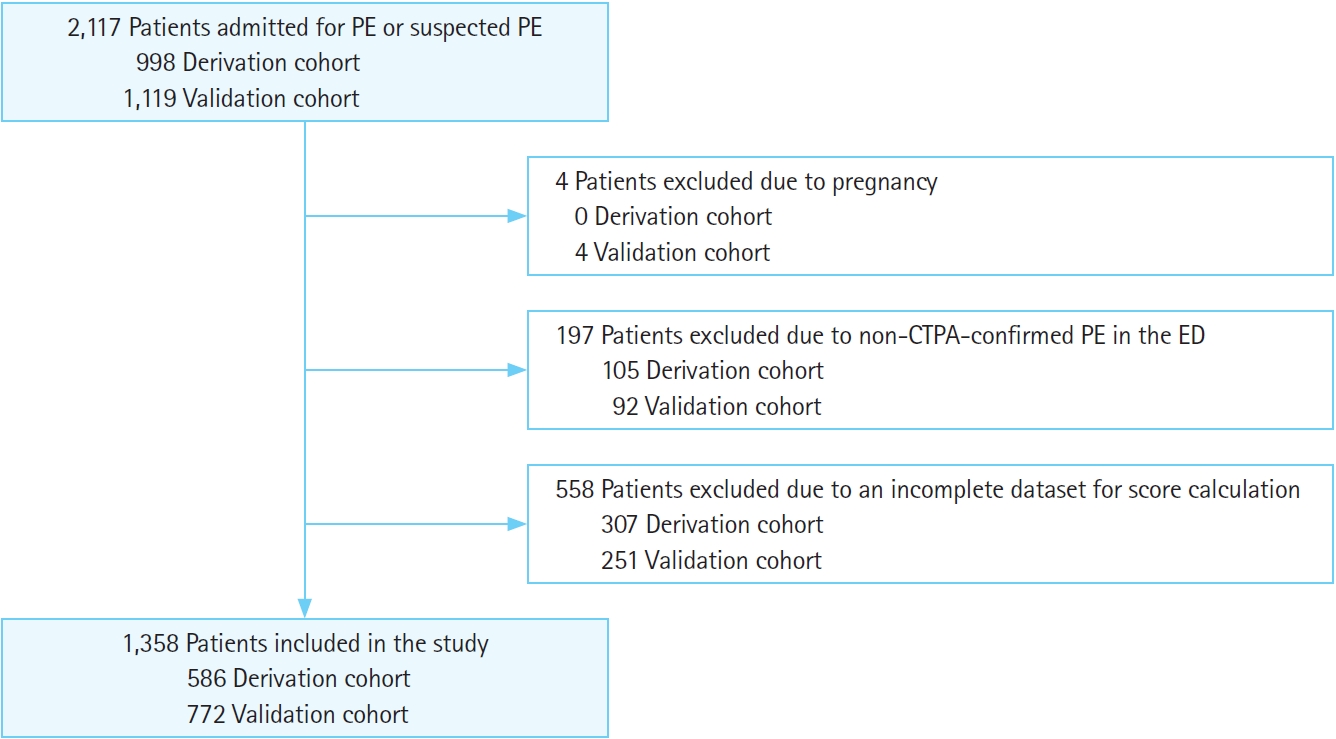
During the study period, 2,117 patients were admitted for PE or suspected PE: 998 in the derivation cohort and 1,119 in the validation cohort. However, 307 and 251 patients were excluded from the derivation and validation cohorts, respectively, for incomplete data. One hundred and five patients from the derivation cohort and 92 patients from the validation cohort were excluded because of non-confirmed PE, and four patients from the validation cohort were excluded due to pregnancy (Fig. 1). Therefore, 1,358 patients were included in the study: 586 in the derivation cohort and 772 in the validation cohort. The patients had a mean age of 69.88 years, and 44.2% of them were male, with a median LoS of 7.5 days (interquartile range, 4.3ŌĆō13.0 days). Overall, 10.5% of the included patients died in the hospital (10.2% in the derivation group and 10.6% in the validation group, P=0.818). Compared with the derivation cohort, the validation cohort was younger and presented to the ED with a higher respiratory rate, heart rate (HR), peripheral oxygen saturation (SpO2), and body temperature; lower systolic blood pressure (SBP); and less-frequent altered mental status. According to the lab values, the validation population presented with a higher platelet count and a higher rate of troponin above the given cutoff value. Patients in the validation cohort had a more frequent history of cancer, lower PESI and higher SI scores, and no difference in the sPESI and PATHOS (platelets, age, troponin, HR, oxygenation, and SBP) scores from patients in the derivation cohort. The LoS was higher in the validation population, with no difference in terms of IHM between the groups (Table 2). Patients with IHM were older and had lower SpO2, SBP, and diastolic BP; higher HR; a higher frequency of altered mental status, troponin value >cutoff, and abnormal platelet count; and higher PESI, sPESI, SI, and PATHOS scores than those who survived to discharge in both the derivation and validation cohorts (Table 3).
Among all the variables identified as potential predictors in the derivation cohort (Table 3), only HR demonstrated a different better cutoff than the previously published value (100 pulses per minute [ppm] instead of 110 ppm). In the end, platelet count <100 or >400├Ś103/╬╝L, age >80 years, troponin >the given cutoff, HR >100 ppm, SpO2 <90%, and SBP <100 mmHg were identified as independent predictors in the multivariable logistic regression and included in the PATHOS score (Tables 1, 4). All PATHOS score items were also shown to be independent predictors in the validation cohort, whereas only three of the 11 PESI items (HR, SBP, and SpO2) were independent predictors in both groups, with age and altered mental status found to be independent predictors only in the validation group. Among the sPESI items, a history of cancer was not an independent predictor in the derivation cohort, and chronic heart failure was not an independent predictor in either cohort (Table 4).
The linear regression model analysis of the PATHOS score showed a B standardized coefficient equal to 0.162 (P=0.001) for platelet count <100 or >400├Ś103/╬╝L, 0.103 (P=0.038) for age >80 years, 0.112 (P=0.031) for troponin >the cutoff, 0.131 (P=0.010) for HR >100 ppm, 0.145 (P=0.005) for SpO2 <90%, and 0.178 (P<0.001) for SBP <100 mmHg. Therefore, one point was assigned to each item. Moreover, each item showed a variance inflation factor of <2.001, excluding multicollinearity.
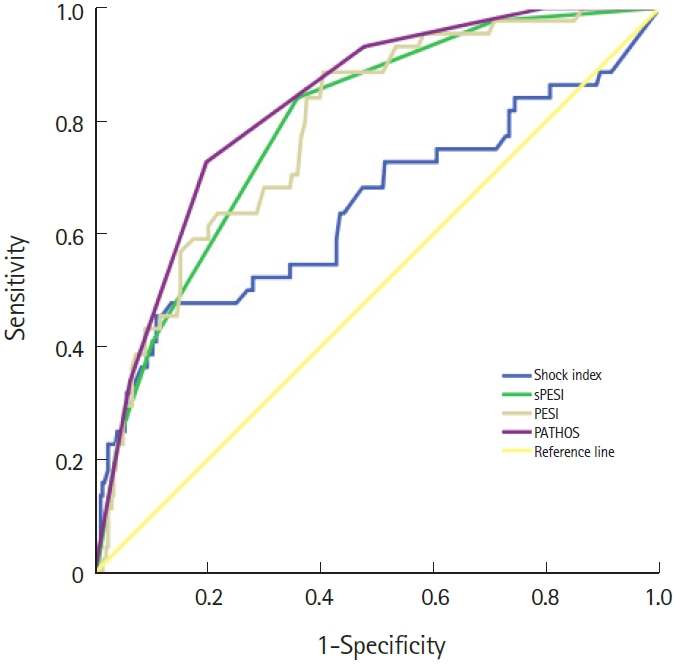
The PATHOS score showed good calibration, with a Hosmer-Lemeshow Žć2=6.15 and P=0.52 in the derivation group and Žć2=1.63 and P=0.977 in the validation group. In the derivation group, the PATHOS score had the highest global accuracy, with an AUROC of 0.827 (95% CI, 0.769ŌĆō0.885), which was significantly higher than that of the PESI (AUROC, 0.786; 95% CI, 0.72ŌĆō0.85; P<0.01), sPESI (AUROC, 0.791; 95% CI, 0.726ŌĆō0.856; P=0.01), and SI (AUROC, 0.64; 95% CI, 0.543ŌĆō0.750; P<0.001) (Fig. 2).
When applied to the validation group, the PATHOS score had an AUROC of 0.74 (95% CI, 0.68ŌĆō0.80), which was also significantly higher than that of the PESI (AUROC, 0.68; 95% CI, 0.61ŌĆō0.74; P=0.013), with no difference between the PESI and sPESI (AUROC, 0.71; 95% CI, 0.64ŌĆō0.77; P=0.24) or between the PESI and SI (AUROC, 0.67; 95% CI, 0.61ŌĆō0.74; P=0.94) (Fig. 3). In the global cohort, a PATHOS score >0 showed a negative predictive value of 98.9 and a negative likelihood ratio of 0.09; whereas a PATHOS score >4 showed a positive predictive value equal to 47% with a positive likelihood ratio of 7. The best cutoff is a PATHOS score >2, which had 60% sensitivity, 81% specificity, a 3.3 likelihood ratio, 30% positive predictive value, and 94% negative predictive value. Moreover, a PATHOS score of 0 is associated with an all-cause IHM risk of 1.8%, a PATHOS score of 6 to IHM risk of 85%, and scores of 2 to 5 are progressively associated with different probabilities due to the slightly different risks associated with each predictor (Table 5).
As illustrated in Table 5, seven IHM risk classes were identified for the PATHOS score (range, 0ŌĆō6). Comparing the PATHOS score with the PESI, the event NRI was ŌĆō0.09, the non-event NRI was 0.31, and the overall NRI was 0.22. To compare the PATHOS score with the sPESI, a low risk of IHM was defined as PATHOS 0 to 1 and high risk of IHM as PATHOS >1. Comparing those two PATHOS score risk classes with the sPESI, the event NRI was ŌĆō0.08, the non-event NRI was 0.29, and the overall NRI was 0.21.
DISCUSSION
Risk stratification, along with the prompt diagnosis and stabilization of critically ill patients, remains a cornerstone of an emergency physicianŌĆÖs daily practice. Predicting which patients have a high or low risk of adverse events determines the most appropriate setting for patients and appropriate resource allocation. The PESI is a complex score that uses 11 clinical parameters to calculate the risk of all-cause 30-day and 6-month mortality [17]. The complexity of the PESI leads to high interoperator variability among users [18,19] and a lower propensity to use it in clinical practice [20,21]. Although PE can significantly affect morbidity and mortality, not every 30-day mortality event is likely to be caused by PE, and a higher 30-day or 6-month mortality risk might not necessarily reflect the short-term mortality risk or the need for intensive care. IHM is recognized as a strong outcome, and correct risk stratification is fundamental for choosing to admit patients to the hospital and determining the intensity of care needed. In this study, we evaluated the prognostic accuracy of the PESI, sPESI, and SI and validated a newly developed risk score for IHM among patients with suspected PE. As reported in Table 3, patients with IHM had worse vital signs and higher PESI, sPESI, and PATHOS scores in both cohorts. However, similar to the results of Jimenez et al. [22] and Vinson et al. [23], different clinical items in the PESI and sPESI, such as sex, respiratory rate, body temperature, history of cancer, and presence of a chronic pulmonary disease, did not appear to be related to IHM in either of our cohorts; thus, those items increased the complexity of calculating the PESI and sPESI scores without improving their accuracy [24ŌĆō27]. In contrast, PATHOS is a simple, easy-to-remember, operator-independent metric that is based on fixed cutoff values and includes only clinical items significantly predictive of IHM. PATHOS demonstrated better diagnostic accuracy than PESI, sPESI, and SI in both the populations evaluated in this study (Figs. 2, 3). Notably, our two cohorts are very different in terms of demographic and clinical characteristics due to their different locations and resident populations, so they reflect the actual variety of patients and the need for a simple and effective score in an emergency setting. Whereas the PESI and sPESI demonstrated the same limitations in our two unselected cohorts, PATHOS score is based on fundamental and easily available items used to assess circulatory shock, pulmonary dysfunction, acute cardiac damage, and platelet count (the latter being an independent predictor of IHM in more conditions than just PE) [8,28ŌĆō30]. According to our results, the positive overall NRIs in the comparisons between PATHOS and PESI and PATHOS and sPESI confirm that PATHOS has better discrimination accuracy than the older measures, showing that a net percentage of 31% (PATHOS vs. PESI) and 29% (PATHOS vs. sPESI) of patients without IHM were correctly reclassified by the new measure. Thus, compared with the other two scores, PATHOS has a higher ability to estimate patients at low risk for IHM than the PESI and sPESI. Moreover, the PATHOS score identified patients with very different risks of IHM with good calibration and the highest accuracy. As shown in Table 5, PATHOS identified patient subsets with low (score, 0ŌĆō1; <6%), moderate (score, 2ŌĆō3; 6%ŌĆō34%), and high risks (score, >3; >34%) of IHM. Moreover, because each clinical item has a slightly different prognostic value, we developed a regression equation (Table 5) to calculate the IHM risk based on the clinical features exhibited by each patient. Markers of cardiac dysfunction, such as those shown in ultrasonographic or chest CT evaluations of RV function, brain natriuretic peptide, or troponin [31ŌĆō34], improve the stratification accuracy of clinical scores and are recommended for correct patient categorization [4]. Moreover, the inclusion of troponin in the clinical score has the advantage of underlining the importance of this biomarker, which could be a valid surrogate of RV dysfunction [35]. Therefore, the PATHOS score is a valuable tool to stratify patients even in settings with no prompt access to echocardiography.
As with any retrospective study, this study has limitations that should be acknowledged. The study cohort included only patients with CTPA-confirmed PE in the ED, which could have led to the exclusion of undiagnosed patients with PE, potentially leading to an incorrect estimation of the evaluated scores. Also, we did not include an echocardiographic or CTPA evaluation of RV dysfunction among the considered items; thus, we could not calculate the ESC risk class. Although that could reduce the risk stratification accuracy, we focused on clinical and easy-to-obtain laboratory parameters to increase the versatility of the new prognostic score in any ED setting. Moreover, due to the lack of generally accepted approaches for estimating the sample size needed for risk prediction models, we did not calculate a formal sample size. However, our study far exceeds the number of events needed for the six-item model developed; thus, it is expected to provide very robust estimates based on the recommended ŌĆ£rule of ten events per predictorŌĆØ in multivariable logistic regression analyses [36]. Because the PESI and sPESI were derived and validated in large datasets [37], the possible superiority of PATHOS over the PESI and sPESI requires more evidence. Further studies are needed to indicate that PATHOS can be practically applied in daily clinical practice in an ED.
In conclusion, the new PATHOS measure incorporates elements of the ESC classification in a simple, unique score and should be useful for stratifying the risk of patients with PE in different ED settings. Although the PESI and ESC classification remain the most recommended risk stratification tools, PATHOS could turn out to be the easiest and most accurate score in daily ED clinical practice if it can be validated in further prospective cohorts.