


INTRODUCTION
Agriculture is an essential industry that meets the basic needs of society, and it employs the largest number of workers globally among all industries [1]. Although the industrial structure and population distribution in Korea have changed since the advent of modern industry, agriculture remains the main industry in many provinces, with about 2.3 million farmers engaged in agriculture in 2020 [2].
Acute injuries among agricultural workers have consistently been ranked as among the highest in all industries, along with transportation and construction [3ŌĆō5]. In addition, fatality rates for agricultural workers in many countries, including the United States, European Union members, and Korea, are invariably several times greater than the average rate for all industries combined [6ŌĆō8].
In 2019, approximately 22.2 million full- and part-time workers were employed in the production agriculture and food industries in the United States. About 410 farmers and farm workers died from a work-related injury, resulting in a fatality rate of 19.4 deaths per 100,000 full-time workers in the United States in 2019 [8].
According to the Korean FarmersŌĆÖ Occupational Disease and Injury Survey, 48,405 farmers suffered an injury that required more than 1 day of absence from work during the previous year. The estimated prevalence of injuries among Korean farmers was 2.7% in 2019 [9].
Although agricultural workers are thus at a very high risk for fatal and nonfatal injuries, few studies of health and safety in the agricultural setting have been done until recently. Injuries to agricultural workers stem from a complex chain of inherent factors, including human (cultural), environmental, and agent factors [10,11]. It is therefore imperative to study the unique epidemiology of injuries to agricultural workers and compare it with injuries to workers in other industries. However, most previous studies focused only on agricultural workers as the study population, with relatively few studies directly comparing agricultural workers with workers in other industries [12ŌĆō17]. Therefore, information about the clinical aspects of injuries to agricultural workers, distinct from other industriesŌĆÖ workers, remains unclear due to a lack of appropriate data sources.
In this study, we set out to compare the clinical characteristics and outcomes of injuries between agricultural workers and nonagricultural workers who visited an emergency department (ED) by establishing a prospective ED-based agricultural injury surveillance system (ED-AgISS).
METHODS
Ethics statement
This study was reviewed and approved by the Institutional Review Board of Jeju National University Hospital (No. 2018-07-011), with a waiver for the need to obtain informed consent.
Study design and setting
We conducted a retrospective analysis of data from the prospective ED-AgISS registry created for the Safety from Agricultural Injury to Farmers (SAIF) study at a tertiary university hospital. SAIF is a comprehensive community- and hospital-based study investigating the occupational and environmental exposures that affect the epidemiology of agricultural injury and its outcomes among farmers residing on Jeju Island. SAIF is supported by the Jeju Center for FarmersŌĆÖ Safety and Health of the Ministry of Agriculture, Food, and Rural Affairs of Korea.
The ED-AgISS was designed as an additional module of the existing ED-based Injury Surveillance System (EDISS) and was intended to provide in-depth occupational injury surveillance for agricultural workers. The Korean Centers for Disease Control and Prevention established the EDISS in 2006 as a nationwide, multicenter prospective registry to investigate general injury epidemiology at 23 EDs in tertiary hospitals [18].
The ED-AgISS was implemented in October 2015 as a two-step in-depth injury surveillance system focused on farmersŌĆÖ occupational injuries. Details in the registry information (standard and expanded datasets) are collected differently depending on occupation (farmers and non-farmers).
Selection of participants
Our eligible study population consisted of all injured adult patients who visited the ED of Jeju National University Hospital (Jeju, Korea) between October 1, 2015, and December 31, 2020. The diagnostic codes of the eligible population were consistent with ŌĆ£injury, poisoning, and certain other consequences of external cause (S00ŌĆōT88)ŌĆØ in the International Classification of Diseases, 10th Revision [19].
The included study population was 18 years or older on the day of the incident and was divided into farmer and non-farmer groups. Patients who died upon arrival at the ED or whose injury severity or final clinical outcome could not be determined were excluded from the final analysis.
Data collection
The primary purpose of the ED-AgISS is to capture the occupation (farmers vs. non-farmers) of injured patients who visit the ED with the omission of as few cases as possible. Therefore, independent investigators from the Jeju Center for FarmersŌĆÖ Safety and Health at Jeju National University Hospital confirmed patient status regarding engagement in agricultural work for all injured patients.
The ED-AgISS registry collects comprehensive information in the following domains using a two-step injury surveillance system: (1) a standard dataset for general injury epidemiology from EDISS and (2) an expanded dataset to establish occupational injury epidemiology among agricultural workers. After routinely obtaining standard EDISS data from all injured patients who visit the ED in the first step, ED staff collected expanded data about injured patients confirmed to be engaged in agricultural work in the second step.
The standard dataset from EDISS includes sociodemographic (age, sex, insurance type, vital signs, and mental status), injury characteristics (intention, mechanism, activities, places, emergency medical service [EMS] usage, and whether the injury was alcohol related), diagnosis, injury severity index (Revised Trauma Score [RTS], Injury Severity Score [ISS]), emergency care process with a time log, treatment, and disposition at the hospital (discharge, interhospital transfer, admission, death) [18].
The expanded dataset contains the characteristics of injuries to agricultural workers based on the occupational injury and illness classification system and agricultural work-related conditions (type of farming, total farming career experience, in-depth category of places, protective devices, and agricultural machinery) (Supplementary Material 1) [20].
Outcomes of interest
Our primary outcome measures in this study were binary indicators of in-hospital 7-day mortality, 14-day mortality, and overall injury-related mortality. The secondary outcomes were indication for surgery (yes or no) within the first 72 hours and admission to the intensive care unit (ICU), which reflects the urgent need for special medical resources.
Statistical analysis
We estimated the propensity scores of each participant using a multivariate logistic regression model for the odds of being allocated to the farmer or non-farmer group, in which the baseline demographics (age, sex, inhabitant, and insurance type) and year of injury were the predictors for the matching criteria. Because of the temporal order associated with a causal relationship, only variables prior to the injury incident were considered as predictors.
We matched each patient in the farmer group with a patient in the non-farmer group using propensity scores calculated with one-to-one nearest-neighbor matching without replacement and within a caliper size of 0.2, which resulted in pairs of patients in the matched sample. Numerical and graphical diagnostics were performed to compare the extent of balance between the two groups in the dataset before and after propensity score matching [21,22]. For each variable used in the matching process, we performed the following analyses: t-tests to compare the equality of means in the two samples, the standardized percentage bias before and after matching with the achieved percentage reduction, and the variance ratio of the farmer group to the non-farmer group. We also calculated the following overall measures of covariate imbalance before and after propensity score matching: pseudo R2 from the probit estimation of the conditional treatment probability (propensity score) for all the variables, with the corresponding P-values from the likelihood ratio test of the joint insignificance of all the regressors; the mean bias as a summary indicator of the distribution of the absolute bias; RubinŌĆÖs B (the absolute standardized difference of the means of the linear index of the propensity score in the treated and nontreated groups); and RubinŌĆÖs R (the ratio of treated to nontreated variances of the propensity score index). If B was less than 25 and R was between 0.5 and 2 for the samples, the groups were considered sufficiently balanced [23].
We calculated descriptive statistics for the baseline demographics, injury epidemiology, and clinical outcomes of the study population stratified by occupation (farmers and non-farmers) before and after propensity score matching. The descriptive statistics are presented as frequencies and percentages for categorical variables and as means┬▒standard deviations or medians with interquartile ranges for continuous variables, depending on the distribution.
Univariate analyses were conducted between the two groups in both the unmatched and matched samples for each baseline demographic variable, injury epidemiology, and clinical outcomes using Student t-test, Wilcoxon rank-sum test, chi-squared test, or Fisher exact test, as appropriate.
In the unmatched sample, a multivariate logistic regression analysis adjusted for age, sex, inhabitant, insurance type, and year of injury was used to identify whether occupation affected the dichotomous primary and secondary outcomes between the farmer and non-farmer groups. A secondary analysis using a bivariate logistic regression was used in the propensity scoreŌĆōmatched sample to identify the relationships between occupation and the outcomes of interest.
All statistical analyses were performed in Stata ver. 17.0 (StataCorp). All tests were two-tailed, and the statistical significance level was <0.05.
RESULTS
Study population flow
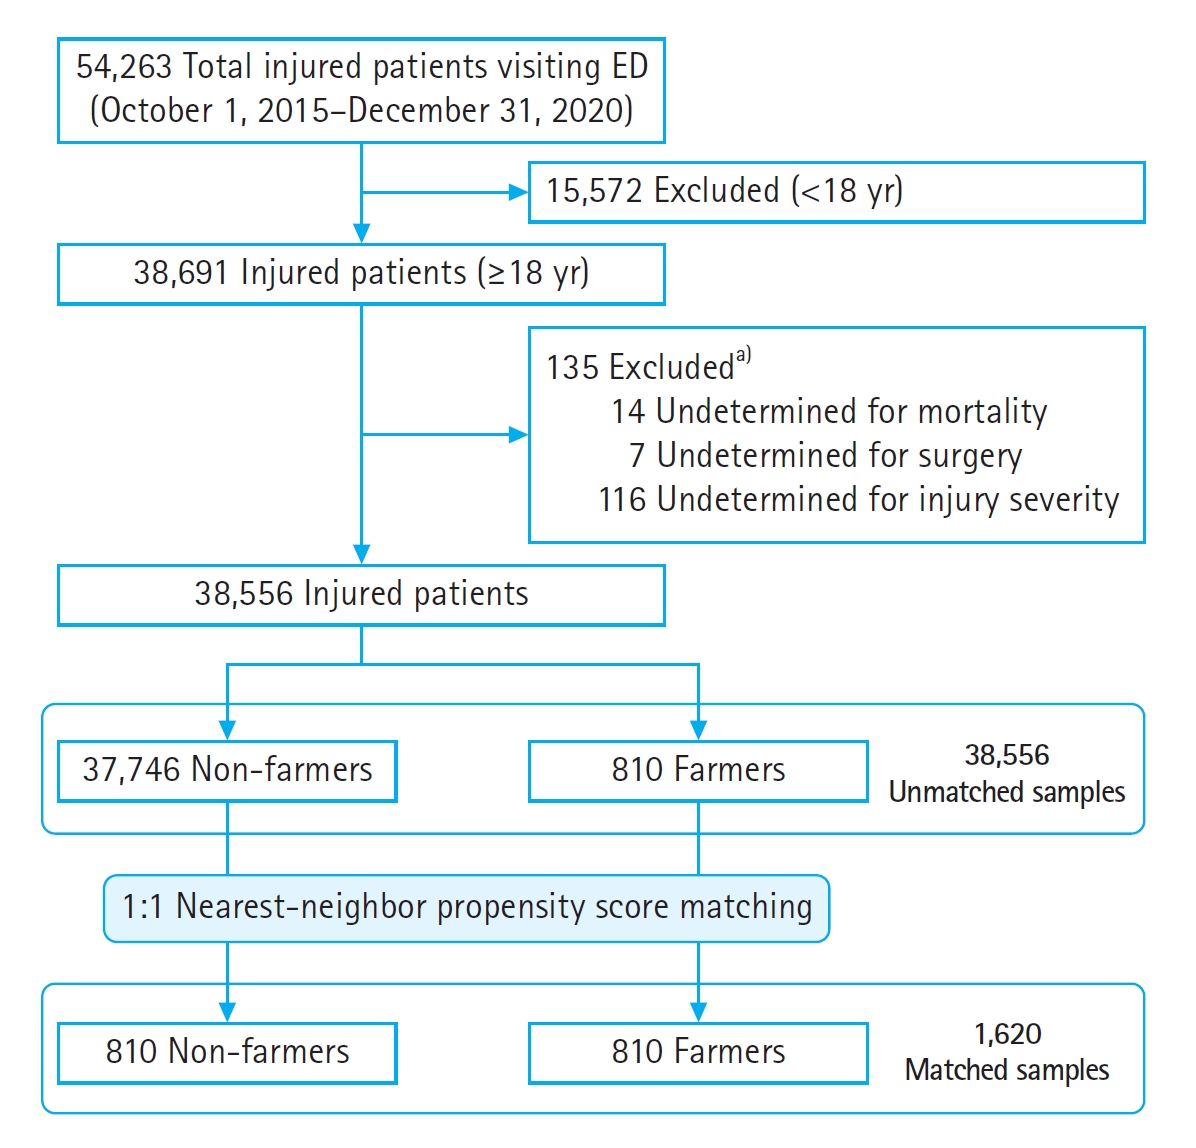
Fig. 1 illustrates the overall flow of the study population. Adult patients (18 years or older) who visited the ED due to trauma from October 2015 to December 2020 were eligible for this study. Among the 38,691 injured adult patients who visited the ED in that time, 135 were excluded because of missing data, leaving 38,556 subjects (37,746 in the non-farmer group and 810 in the farmer group) for the unmatched sample analysis and propensity score matching. After one-to-one nearest-neighbor propensity score matching, the 1,620 matched subjects were equally classified into the two groups (non-farmers and farmers).
Baseline demographics
Table 1 provides a comparison of the baseline demographics between the farmer and non-farmer groups before and after propensity score matching. In the unmatched sample, the patients' demographics prior to the injury event differed significantly between the groups (farmer vs. non-farmer) in terms of sex (female sex, 37.3% vs. 44.3%), age (61.1┬▒13.2 years vs. 47.6┬▒18.8 years), inhabitant (visitors, 1.6% vs. 16.5%), insurance type (auto insurance, 4.8% vs. 18.6%), and distribution in the year. In addition, we found statistically significant differences in demographics related to the injury, such as alcohol-relatedness of the injury, EMS usage, AVPU (alert, verbal, pain, unresponsive) mental status, Glasgow Coma Scale (GCS) score, systolic blood pressure <90 mmHg, and disposition (P<0.05).
After propensity score matching, several of the differing baseline demographics (age, sex, inhabitant, insurance type, and year of injury) were balanced in the matched sample. After matching, alcohol-related injury and disposition still differed significantly, but EMS usage, AVPU mental status, GCS score, and systolic blood pressure <90 mmHg no longer differed significantly between farmers and non-farmers.
Injury characteristics
The injury characteristics in the farmer and non-farmer groups before and after matching are presented in Table 2. In both the unmatched and propensity scoreŌĆōmatched samples, most of the injury characteristics differed between the two groups. After matching, the trend for group differences in the distribution of injury characteristics persisted and even became more pronounced. In particular, injured patients in the farmer group were more likely than those in the non-farmer group to have an accidental injury, cut or penetrating injury, injury that occurred during paid work activity, injury that occurred in an outdoor workspace, and a temporal incidence pattern involving non-winter, weekend, and daytime injuries. On the other hand, injured patients in the non-farmer group were more likely than those in the farmer group to have an intentional violent injury, fall or slip as the mechanism of injury, injury during vital or unpaid work activity, injury occurring indoors in the home or residence, and a temporal incidence pattern involving winter, weekday, and other than daytime injuries.
Injury severity and clinical outcomes
The descriptive statistics for injury severity and clinical outcomes are presented in Table 3, and the odds ratios (ORs) for clinical outcomes in the farmer group, compared with the non-farmer group, are summarized in Table 4.
Injury severity (RTS and ISS) and clinical outcomes (in-hospital mortality, ICU admission, and surgery) differed significantly between the two groups in the unmatched sample. The injured patients in the farmer group had a higher injury severity, greater mortality within 14 days, and a greater rate of ICU admission, and they required surgery more frequently than those in the non-farmer group. After propensity score matching, however, the differences in injury severity and clinical outcomes were not significant between the groups, except for the indication for surgery. In the matched sample, injured patients in the farmer group had a greater rate of surgery than those in the non-farmer group.
The results of the multivariate logistic regression analysis in the unmatched sample adjusted for age, sex, inhabitant, insurance type, and year of injury, and the results of the univariate logistic regression analyses in the matched sample for the primary and secondary outcomes are summarized in Table 4. In the multivariate logistic regression analysis of the unmatched dataset (n=38,556), farmers showed a higher likelihood of ICU admission (adjusted OR, 1.752; 95% confidence interval [CI], 1.205ŌĆō2.547; P=0.003) and higher odds of undergoing surgery overall (adjusted OR, 1.870; 95% CI, 1.569ŌĆō2.229, P<0.001), within 24 hours (adjusted OR, 3.025; 95% CI, 2.133ŌĆō4.290; P<0.001), within 48 hours (adjusted OR, 2.323; 95% CI, 1.708ŌĆō3.157; P<0.001), and within 72 hours (adjusted OR, 2.086; 95% CI, 1.578ŌĆō2.757; P<0.001) compared with non-farmers. However, overall injury-related mortality (adjusted OR, 1.358; 95% CI, 0.592ŌĆō3.115; P=0.470), mortality Ōēż7 days (adjusted OR, 2.258; 95% CI, 0.969ŌĆō5.259; P=0.059), and mortality Ōēż14 days (adjusted OR, 1.792; 95% CI, 0.775ŌĆō4.140; P=0.172) did not differ significantly between the groups.
In the univariate logistic regression analyses of the propensity scoreŌĆōmatched sample (n=1,620), overall injury-related mortality (OR, 1.000; 95% CI, 0.321ŌĆō3.114; P>0.999), mortality Ōēż7 days (OR, 3.015; 95% CI, 0.607ŌĆō14.982; P=0.177), mortality Ōēż14 days (OR, 2.007; 95% CI, 0.500ŌĆō8.054; P=0.326), and ICU admission (OR, 1.425; 95% CI, 0.818ŌĆō2.484; P=0.211) did not differ significantly between farmers and non-farmers. However, farmers still showed higher odds of undergoing surgery overall (OR, 1.786; 95% CI, 1.377ŌĆō2.317; P<0.001), within 24 hours (OR, 2.609; 95% CI, 1.423ŌĆō4.781; P=0.002), within 48 hours (OR, 1.759; 95% CI, 1.092ŌĆō2.834; P=0.020), and within 72 hours (OR, 1.708; 95% CI, 1.109ŌĆō2.629; P=0.015) compared with non-farmers.
DISCUSSION
We established the prospective ED-AgISS to compare the characteristics and outcomes of injuries to agricultural workers with those to nonagricultural workers. In the unmatched sample, a multivariate logistic regression analysis revealed that injury-related mortality did not differ significantly between the farmer and non-farmer groups, whereas the farmer group had higher adjusted ORs for ICU admission and surgery. After propensity score matching, ICU admissions did not differ significantly between the farmer and non-farmer groups, but injured patients in the farmer group still required surgery more frequently than those in the non-farmer group.
Limited information is available about the clinical aspects and outcomes of nonfatal injuries to agricultural workers because obtaining comprehensive data about nonfatal injury events is more complex than obtaining data on fatal injuries [24]. Thus, the burden of injuries to agricultural workers on the ED is not well quantified.
Korea's proportion of injuries to agricultural workers at the ED during a 4-month period was 6.3% in a pilot study for developing an ED-based occupational injury surveillance system [25]. A descriptive study in North Carolina, USA reported that an average of 459 farm injury cases occurred annually from 2008 to 2012, with little yearly variation, based on syndromic surveillance data gathered by the ED [15]. In our study of all adult patients visiting the ED, 810 injured patients were engaged in agriculture, and the overall proportion of agricultural injuries was 2.1% (range, 1.5%ŌĆō3.1%) during the study period. The burden of injuries to agricultural workers reported in other studies was higher than in our study (an average of 135 cases annually and an overall proportion of 2.1%). Those differences might be due to geographic variations and the extent of the surveillance system.
Among our 810 injured agricultural workers who visited the ED, 508 (62.7%) were men, and the mean age was 61.1┬▒13.2 years. Several injury characteristics differed between the farmer and non-farmer groups in the unmatched sample. Injuries to agricultural workers (compared with nonagricultural workers) occurred mainly outdoors (90.6% vs. 57.2%), during paid work (90.0% vs. 14.4%), and involved unintentional accidents (96.2% vs. 92.2%), and the most common location was the workspace (65.4% vs. 8.6%). The major injury mechanisms were fall or slip (26.4% vs. 28.4%) and cut or penetrating injuries (20.9% vs. 12.3%), rather than motor vehicle collisions (10.3% vs. 22.5%). No one in our study population was covered by industrial insurance.
These results are consistent with previous findings that evaluated the characteristics and factors associated with agricultural injuries: a higher proportion of older individuals, more men than women, low worker compensation coverage, more accidental than intentional injuries, and major injury mechanisms involving lacerations and sprain or strain that occurred in the farm field during paid work with time variation in terms of season, days of the week, and daytime events [10,12,16,26,27].
However, most previous studies evaluated those results only in agriculturally engaged populations, whereas our study provides the detailed injury epidemiology of occupation-associated differences from nonagricultural workers. We also found that several baseline demographics of injured patients differed significantly between the farmer and non-farmer groups in the unmatched sample: sex, age, inhabitant, insurance type, distribution in the year, alcohol-relatedness, EMS usage, AVPU mental status, GCS score, systolic blood pressure <90 mmHg, and disposition (all P<0.05). Among those factors, the five patient demographic differences (age, sex, inhabitant, insurance type, and year of injury) can be considered unique host factors prior to the injury event.
Because of concerns about the difficult-to-adjust structural confounding associated with the observational study design and the relatively small size of the farmer's group, our analysis using a traditional regression model or covariate adjustment approach was inadequately robust in handling endogeneity bias, which made it challenging to assess the impact of occupation (farmers vs. non-farmers) on injury epidemiology and clinical outcomes. Therefore, we adopted a propensity score matching approach to balance the participantsŌĆÖ baseline demographics and sample size between the groups [23].
Tables 5 and 6 show the extent of the balance between the two samples before and after matching. For each matching variable, the absolute standardized mean difference was less than 0.05, indicating that the covariates were balanced in the matched samples. There was almost a 94.8% (range, 86.8%ŌĆō98.5%) reduction in these covariates' standardized mean differences after matching [22]. Fig. 2 shows the extent of covariate imbalance as standardized percentage differences using dot charts.
We also calculated overall measures of covariate imbalance before and after propensity score matching. RubinŌĆÖs B (the absolute standardized difference of the means) and RubinŌĆÖs R (the ratio of treated to nontreated variances in the propensity score index) were 7.4 and 1.28, respectively, in the matched sample, which is considered to indicate sufficient balance [23].
Only alcohol-related injury and ED disposition differed significantly among the demographics after propensity score matching; EMS usage, AVPU mental status, GCS score, and systolic blood pressure <90 mmHg did not differ significantly after matching. A possible explanation for these results is that the group demographic differences at the time of injury were associated with host factors that could not modify the characteristics of farm workers compared with non-farmers. However, one interesting finding is that the group differences in the distribution of most injury characteristics remained statistically significant in both the unmatched and matched samples. These group differences in injury characteristics, which persisted after achieving a similar distribution of host factors across farmers and non-farmers, might be associated with occupational influences.
Similar to previous studies, the results of this study show that the farmer group had significantly higher rates of ICU admission, surgery, and injury-related mortality than the non-farmer group [28ŌĆō31]. However, the multivariate logistic regression analysis in the unmatched sample adjusted for age, sex, inhabitant, insurance type, and year of injury showed that the adjusted OR for injury-related mortality was not statistically significant. Furthermore, univariate logistic regression analyses of the propensity scoreŌĆōmatched sample showed that only the OR for the rate of surgery was significant.
These findings are somewhat surprising given that other studies have reported high mortality and morbidity rates among agricultural workers [4,7,10,17,25,28ŌĆō31]. A potential reason for this discrepancy could be the study design and setting. Our participants were injured patients who visited the ED. Several previous studies evaluating the mortality and morbidity of injuries to agricultural workers used data sources such as industrial compensation records, insurance claims data, and working condition surveys [12,17,25,32ŌĆō34]. Therefore, the participants in our study might have had mainly nonfatal injuries because our study excluded individuals who died in the prehospital phase. Another possible reason could be our statistical analysis method. We used a multivariate logistic model and propensity score matching to control for the effect of host confounders on clinical outcomes. Therefore, our results about clinical outcomes need to be interpreted with caution and should be limited to patients with nonfatal injuries who visit an ED, rather than being extrapolated to all injuries to agricultural workers.
These findings suggest that the targets for preventing injuries to agricultural workers might differ depending on the timing of the injury. Primary prevention could be an important prehospital phase intervention to prevent fatal injuries to agricultural workers, such as by providing rollover protection structures and seatbelts on tractors [35]. Additionally, preventive efforts to reduce the morbidity of nonfatal injuries to agricultural workers need to be prioritized in the hospital phase. Thus, ED physicians should understand the special considerations needed to manage acute injuries to agricultural workers, including the triad of Ts: excessive time until treatment, excessive trash or wound contamination, and excessive trauma to tissues and organs [36]. Human resources sufficient to perform operations such as reconstruction, attachment, and amputation are also essential because of the high likelihood that injuries to agricultural workers will require surgery.
Our study has several limitations that require attention. First, the major limitation of our study population is that it does not adequately represent the target populations. Thus, our results must be interpreted cautiously and should not be extrapolated to the severity of all work-related agricultural injuries. Our findings represent nonfatally injured agricultural workers who visited an ED. Second, we excluded 135 participants from the 38,691 eligible participants because of missing essential variables. Although the size of the excluded sample was relatively small (0.3%), the proportion in the farmer group was significantly higher than that in the non-farmer group (2.8% vs. 0.3%, P<0.001). Therefore, the possibility of bias other than systematic missing data cannot be excluded. Third, the regional generalizability of our study is weak because our study population was obtained from a small subset in only one province. In addition, injuries to agricultural workers have been strongly associated with environmental and safety cultures at the farm and individual levels. Therefore, the generalizability of these results to other regions might be limited.
In summary, we have identified differences in injury characteristics between agricultural and nonagricultural workers and found a significantly higher rate of surgery among agricultural workers and no significant differences in injury-related mortality in both the matched and unmatched samples. Our findings suggest the importance of tailoring injury prevention targets and strategies for agricultural workers to emphasize primary prevention for fatal injuries in the prehospital phase and preventive efforts to reduce the morbidity of nonfatal injuries in the hospital phase.