


INTRODUCTION
Community-acquired pneumonia (CAP) is the most common cause of death among infectious diseases, with a mortality rate ranging from 12% to 14% [1]. Pneumonia is associated with a particularly high mortality rate in elderly adults [1,2]. These patients often have longer hospital stays, more comorbidities, and greater disease severity than younger patients, necessitating consistent preparedness for adverse prognostic outcomes [2,3].
After CAP diagnosis, predicting its severity is crucial for appropriate treatment [4,5]. Failure to appropriately predict the severity or risk of CAP-related death can increase medical costs [6,7]. Patients who could be treated as outpatients might be unnecessarily hospitalized, and those requiring hospitalization might receive only outpatient treatment, leading to the deterioration of their condition [7,8]. The mortality rate was higher in patients with CAP who were initially treated as outpatients and later hospitalized, as well as in patients who were not initially admitted to the intensive care unit (ICU) despite high disease severity [9,10]. Accurately predicting the severity of pneumonia depends on the medical staff’s clinical judgment. Objective criteria such as the pneumonia severity index (PSI) and the CURB-65 (confusion, urea, respiratory rate, blood pressure, age ≥65 years) metric continue to be widely used to predict the prognosis of CAP [1,2]. However, those criteria can be ineffective in some clinical settings, particularly emergency departments. The PSI is difficult and inconvenient to apply in actual clinical settings because it requires the calculation of 20 different variables [1,7]. CURB-65 is simpler than the PSI, but its accuracy tends to decrease as patient age increases [11]. Therefore, a new criterion that is more applicable and accurate than existing criteria is needed to accurately predict the prognosis of CAP in practical clinical settings [7,12].
Sarcopenia, a progressive skeletal muscular disease associated with aging, is characterized by decreased muscle mass and function [13]. Skeletal muscle depletion can deteriorate respiratory muscle function, lead to diaphragm atrophy, impair swallowing muscles, and decrease coughing function, all of which can exacerbate pneumonia in patients [14,15]. Therefore, when deciding on effective treatments and predicting the prognosis of patients with pneumonia, it is beneficial to consider sarcopenic indicators, such as skeletal muscle depletion [15]. In general, magnetic resonance imaging (MRI) or dual-energy x-ray absorptiometry (DXA) is used to evaluate sarcopenia [16]; however, those procedures are difficult to use in emergency medical centers. Computed tomography (CT) can also be used to evaluate muscle mass and predict the prognosis of patients with a wide range of infectious diseases, including pneumonia [15–18]. The use of chest CT to diagnose pneumonia in patients visiting emergency medical centers has been steadily increasing, which means that skeletal muscle mass and composition can also be evaluated without requiring an additional test or cost [16]. Previous studies have used the paraspinal muscle index and muscle attenuation to evaluate sarcopenia and predict the prognosis of pneumonia [19,20]. However, the association remains unclear because only a few studies have examined it.
In this study, we evaluate the prognostic utility of paraspinal muscle measurements on chest CT as a predictor of 28-day mortality in elderly patients with CAP. We hypothesized that a high paraspinal muscle index and muscle attenuation would be associated with low 28-day mortality.
METHODS
Ethics statement
The study was approved by the Institutional Review Board of Kyung Hee University Hospital (No. 2023-09-008). The requirement for informed consent was waived due to the retrospective nature of the study.
Study population and data collection
In this single-center, retrospective, observational study, we enrolled patients with pneumonia who were admitted between March 2020 and December 2022 through a regional emergency medical center with 30,000 annual visits. The inclusion criteria were as follows: (1) the presence of new or progressive infiltrate on a chest radiograph or CT; (2) community-onset (including healthcare-associated onset defined as outpatient infusion therapy or chemotherapy or home wound care in the previous 30 days, nursing home or long-term care facility, chronic dialysis, or hospitalization for 2 days in the 90 days before admission); (3) admission and discharge diagnoses of CAP; and (4) age ≥65 years at diagnosis. The exclusion criteria were as follows: (1) patients with hospital-acquired pneumonia; (2) the presence of metal prostheses; (3) those transferred or discharged against medical advice; (4) those without chest CT scans within 48 hours before or after hospitalization; and (5) those missing the baseline laboratory exams or medical records needed to calculate PSI and CURB-65 scores.
Emergency medicine doctors accessed the enrolled patients’ electronic medical records (EMR) to collect data. Data on age, sex, body mass index, level of consciousness, vital signs, blood test results, underlying diseases, and clinical findings at the first visit were obtained, and the clinical frailty scale was determined by reviewing the EMR. Enrolled patients underwent chest CT using a 64-slice multidetector CT scanner (Philips Brilliance 64 Slice, Phillips Healthcare) in the emergency department or within 48 hours after hospital admission. All chest CT images acquired before or after 48 hours of hospitalization were included in the evaluation, regardless of CT technique, such as the use of a contrast agent or high-resolution CT. Data about the timing of each chest CT were collected, and the distribution of timing was investigated. A board-certified radiologist diagnosed pneumonia using images stored in picture archiving and communication system (PACS) software (Infinitt Healthcare).
Measurement of paraspinal muscle area, index, attenuation
Two emergency medicine doctors blinded to each patient’s basic characteristics and medical results independently measured the paraspinal muscles using axial chest CT images stored in the PACS. Each doctor measured them twice to minimize human errors, and we used the average of the four values.
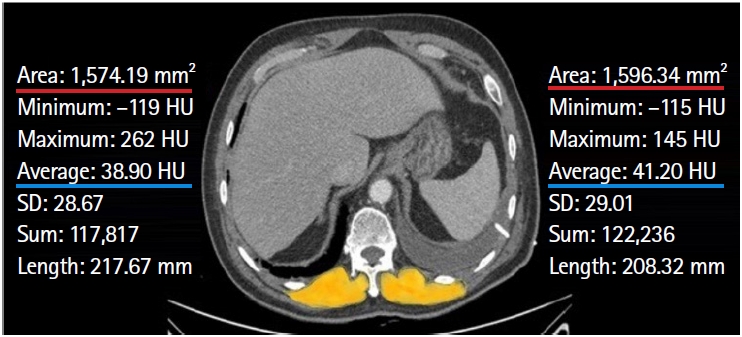
Similar to previous studies on the correlation between pneumonia and sarcopenia [19–23], the muscles on both sides of the 12th thoracic vertebral spinous process were measured manually using the "measure area freehand" tool available in the PACS software (Fig. 1). The paraspinal muscle areas encompassed all muscles bilaterally posterior to the 12th thoracic vertebral spinous process. The reviewers manually differentiated muscular tissues from adipose tissues by demarcating specific regions of interest in the images. The PACS software automatically derived the paraspinal muscle area (mm2) and muscle attenuation (Hounsfield units, HU).
The average muscle area on both sides was used to determine the paraspinal muscle index, which was calculated as the average muscle area (mm2) surrounding the spinous process divided by the square of the patient's height (m2). This calculation was performed to adjust the average of the measured muscle areas with respect to patient height [15,20].
Calculation of PSI and CURB-65
PSI and CURB-65 scores were calculated with reference to CAP treatment guidelines [1,2,7]. The PSI was calculated using 20 variables: demographics (age, sex, and nursing home resident), comorbidities (cerebrovascular disease, neoplastic disease, congestive heart failure, chronic renal disease, and chronic liver disease), physical examination results (altered mental status, systolic blood pressure, pulse rate, respiratory rate, and temperature), laboratory findings (hematocrit, glucose, blood urea nitrogen, sodium, arterial pH, and PaO2), and radiological findings (pleural effusion) [2]. Total PSI scores were calculated and classified into five risk classes [1,7]. CURB-65 is derived from five factors (confusion, blood urea nitrogen, respiratory rate, systolic or diastolic blood pressure, and age) and represented on a 6-point scale ranging from 0 to 5 [1,7].
Study outcomes
The primary outcome of this study was 28-day mortality. The secondary outcome was ICU admission.
Statistical analysis
Categorical variables are expressed as absolute values (percentages), and continuous variables are expressed as mean±standard deviation (SD). Each variable was analyzed using the chi-square or Fisher exact test for categorical variables and the Student t-test for continuous variables. To identify independent factors affecting prognosis, variables with a P-value of <0.05 in the univariable logistic regression analysis were taken as candidates for the multivariable logistic regression analysis. After collinearity was tested for each univariable predictor, a logistic regression model of the eligible variables was constructed using the backward elimination method. The odds ratio (OR) and 95% confidence interval (CI) of each variable remaining in the multivariable logistic regression analysis were then calculated.
We also compared the predictive power of paraspinal muscle measurements for 28-day mortality with that of the PSI and CURB-65 as reference diagnostic tools. The receiver operating characteristic (ROC) curve and area under the curve (AUC) were calculated to evaluate the predictive power of the prognostic indicators. The DeLong test was used to compare differences in the AUCs between models. Youden's index, defined as “sensitivity + specificity – 1,” was derived from the ROC curve. The point on the curve that maximized Youden index was identified as the optimal cutoff value. Sensitivity and specificity were calculated at this threshold. The 95% CIs for the area under the receiver operating curve (AUROC), sensitivity, and specificity were computed using 2,000 stratified bootstrap replicates.
Intraclass correlation coefficients (ICCs) were used by the two reviewers to determine the reliability of their measurements. ICCs between 0 and 0.20 were taken to indicate poor agreement, 0.21 to 0.40 as fair agreement, 0.41 to 0.60 as moderate agreement, 0.61 to 0.80 as good agreement, and 0.81 to 1.00 as excellent agreement.
All statistical analyses were conducted in IBM SPSS ver. 27.0 (IBM Corp) and R ver. 4.3.0 (R Project for Statistical Computing). A two-tailed P<0.05 was considered statistically significant.
RESULTS
Patient characteristics
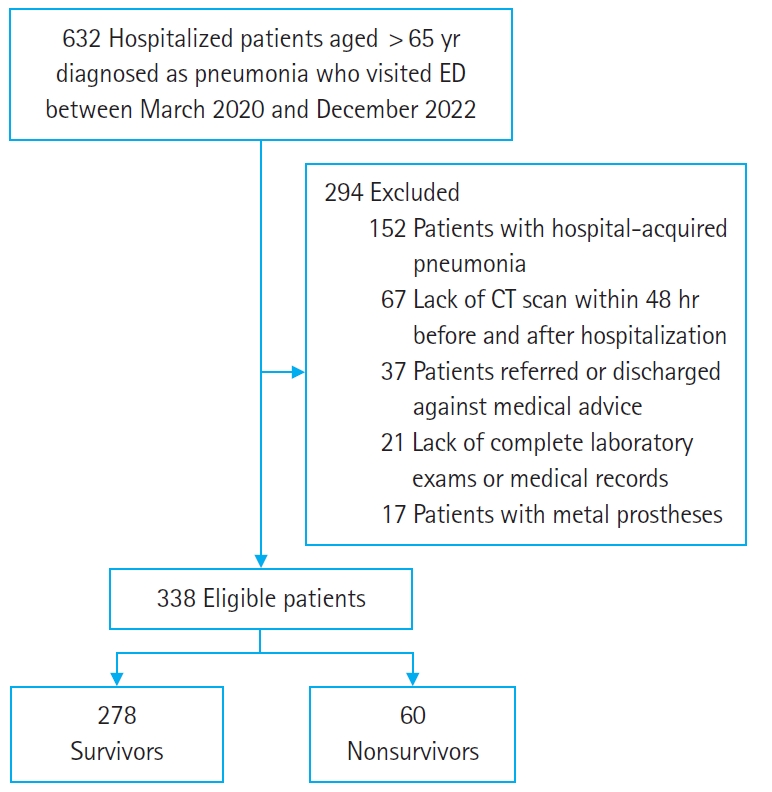
Of the 632 patients aged 65 years and older who were hospitalized for pneumonia after visiting the emergency medical center, 294 were excluded from the study: 152 patients with hospital-acquired pneumonia, 67 who did not undergo chest CT within 48 hours before or after admission, 37 who were transferred or discharged against medical advice, 21 with incomplete laboratory exams or medical records, and 17 with metal prostheses. Of the 338 patients eligible for the study, 278 (82.2%) survived, and 60 (17.8%) died within 28 days (Fig. 2).
The baseline characteristics of the study participants are shown in Table 1. The mean age of the patients was 78.6±7.4 years, 215 patients (63.6%) were male, and 58 (17.2%) had an altered mental status at the time of the initial visit. On the clinical frailty scale, the patients had a mean score of 5.3±1.9. The mean total PSI score was 122.0±34.7, including 163 patients (48.2%) in class IV and 108 patients (31.9%) in class V. The mean CURB-65 score was 2.3±1.0. The PSI score of survivors (117.4±31.7) was lower than that of nonsurvivors (143.5±40.0, P<0.001). The CURB-65 score of survivors (2.2±0.9) was also lower than that of nonsurvivors (2.7±1.1, P<0.001).
Paraspinal muscle measurements
Two reviewers measured paraspinal muscle area and attenuation in all 338 patients. The reliability of the muscle area and attenuation measurements between reviewers 1 and 2 was excellent. The ICC for the muscle area measured by the two reviewers was 0.938 (95% CI, 0.927‒0.947), and the ICC for muscle attenuation was 0.984 (95% CI, 0.981‒0.986) (Supplementary Table 1).
Table 1 presents the muscle area, muscle attenuation, and muscle index of the study population. The mean muscle area was 940.1±423.3 mm2. The mean paraspinal muscle index was 361.1±157.7 mm2/m2, and mean muscle attenuation was 33.8±14.4 HU. The mean paraspinal muscle index in the survivor group (384.4±156.3 mm2/m2) was significantly higher than that in the nonsurvivor group (253.1±114.3 mm2/m2, P<0.001). Muscle attenuation was also higher in the survivor group (34.7±14.5 HU) than in the nonsurvivor group (29.7±13.7 HU, P=0.012).
Association between muscle measurements and 28-day mortality
The results of the univariable logistic regression analysis to find risk factors associated with 28-day mortality are shown in Table 2. Several factors were associated with poor prognosis: male sex, alterations in consciousness, systolic blood pressure, heart rate, respiratory rate, oxygen saturation, body temperature, blood urea nitrogen, albumin, potassium, pH, lactic acid, muscle index, and muscle attenuation (P<0.05). A multivariable logistic regression analysis was performed, and the adjusted OR for the muscle index was 0.994 (95% CI, 0.992–0.997). This indicates that a high paraspinal muscle index in elderly patients with CAP is associated with low 28-day mortality.
Comparison of predictive performance for 28-day mortality
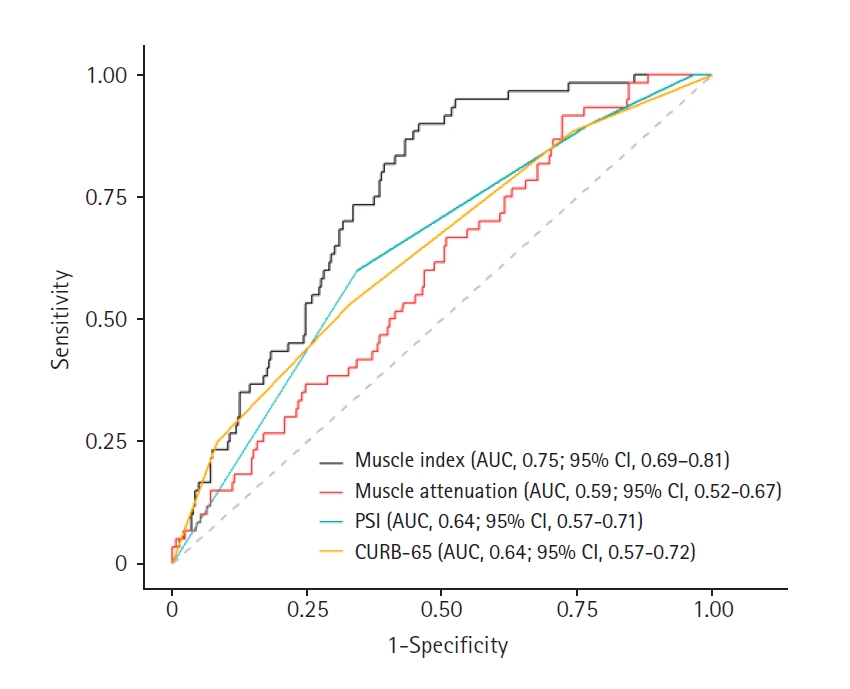
ROC curves and AUC values were calculated to evaluate whether the paraspinal muscle index and muscle attenuation are superior to the PSI or CURB-65 in predicting 28-day mortality. The AUROCs for 28-day mortality are presented in Fig. 3. The AUROC for the muscle index was 0.75 (95% CI, 0.69–0.81). At the optimal cutoff value of 379.8 mm2/m2, sensitivity was 90%, and specificity was 54% (Table 3). The AUROC for muscle attenuation was 0.59 (95% CI, 0.52–0.67), with a sensitivity of 92% and specificity of 28% at the optimal cutoff value of 45.0 HU. The AUROC for the PSI was 0.64 (95% CI, 0.57–0.71), and for CURB-65, it was 0.64 (95% CI, 0.57–0.72), indicating similar predictive power between the two metrics. The AUROC comparison between the muscle index and PSI showed a statistically significant difference (P=0.016), similar to that between the muscle index and CURB-65 (P=0.015). The muscle index had the highest predictive power for 28-day mortality, followed by the PSI, CURB-65, and muscle attenuation, in that order.
Predictive performance of muscle measurement for ICU admission
Of the 338 patients, 72 (21.3%) were admitted to the ICU. For the muscle index, the ICU nonadmission group had a mean of 374.8±157.7 mm2/m2, which was significantly higher than the mean of 310.7±148.4 mm2/m2 in the ICU admission group (P=0.002) (Supplementary Table 2). Muscle attenuation, however, did not show any statistically significant differences between the ICU admission groups. In the multivariable regression analysis, the muscle index had an OR of 0.997 (95% CI, 0.995–0.999; P=0.002) (Supplementary Table 3).
When the AUROCs were calculated to evaluate the predictive power for ICU admission, the paraspinal muscle index showed lower predictive power than the PSI and CURB-65 (Supplementary Fig. 1). The AUROCs for the muscle index and muscle attenuation were 0.62 (95% CI, 0.55–0.69) and 0.49 (95% CI, 0.41–0.57), respectively, whereas the AUROCs for the PSI and CURB-65 were 0.68 (95% CI, 0.62–0.74) and 0.71 (95% CI, 0.65–0.77), respectively. CURB-65 thus had the highest AUROC, followed by the PSI, muscle index, and muscle attenuation (Supplementary Table 4).
DISCUSSION
In this study, the paraspinal muscle index derived from chest CT in elderly patients with CAP was found to be associated with 28-day mortality, and it showed predictive performance superior to that of the PSI and CURB-65.
Sarcopenia causes age-related loss of skeletal muscle function and muscle mass in 6% to 22% of elderly adults [24]. Reduced muscle strength suggests sarcopenia, and the diagnosis is confirmed when the quantity or quality of muscle declines, with a reduction in physical function indicating severe sarcopenia [24,25]. The quantity and quality of sarcopenia are evaluated using various definitions and measurement methods [16,24]. Muscle mass can be measured using imaging techniques such as DXA, MRI, and CT [16]. Chest CT is commonly used in emergency medical centers to diagnose pneumonia. Therefore, sarcopenia can be quickly and simultaneously assessed by using CT to also measure muscle mass [15,20,25]. Assessing muscle depletion by measuring the muscles on both sides of the 12th thoracic vertebral spinous process has been proved useful in previous studies [19,20]. The paraspinal muscle area was associated with in-hospital mortality in critically ill patients with severe CAP admitted to the ICU [19], and the paraspinal muscle index showed superiority to CURB-65 in predicting ICU admission and mortality from pneumonia in patients older than 65 years [20].
In infectious diseases, such as pneumonia, muscle atrophy plays a more important role in prognosis than muscle composition [15,25]. Sarcopenia measured at the psoas muscle was associated with 90-day mortality in adult patients with sepsis [18]. Elderly patients tend to experience recurrent acute and chronic inflammation, which promotes cytokine production and reduces muscle mass through protein catabolism [15,25–27]. Proinflammatory cytokines are negatively correlated with muscle mass and strength, and high serum inflammatory markers have been linked to sarcopenia [27–29]. In addition, skeletal muscles regulate immune responses through myokine signaling and the expression of immunomodulatory surface molecules, and immune cells have a critical influence on muscle mass and function [29].
Muscle attenuation is related to the lipid composition of the muscle [30]. When the intramuscular lipid concentration increases by 1 g/100 mL, muscle attenuation on CT decreases by 1 HU [30]. Increased lipid content in skeletal muscle is an age-related process that can lead to mitochondrial dysfunction and decrease oxidative metabolism [31,32]. Predicting prognosis using muscle attenuation has not shown consistent results. Boutin et al. [33] reported that the paraspinal muscle index and muscle attenuation could predict survival times in elderly patients with hip fractures. However, in a study by Ahn et al. [34], muscle attenuation did not show significant results in predicting in-hospital mortality or ICU admissions in elderly patients who underwent surgery for proximal femoral fractures. In addition, a study of critically ill patients with severe CAP admitted to the ICU reported that the value obtained by multiplying the muscle index and attenuation produced more significant results than muscle attenuation alone [19]. Similar results were observed in patients who underwent fenestrated-branched endovascular aortic repair; the multiplied value was more significant for survival than attenuation alone [35]. Intramyocellular and intermuscular fat cannot be distinguished on CT, and using contrast agents for CT can affect muscle attenuation [16]. Lipids stored in muscles are associated with energy metabolism, obesity, insulin resistance, and diabetes [30]. Therefore, muscle attenuation is assumed to reflect sarcopenia less accurately than the muscle index. In this study, muscle attenuation did not adequately reflect patient prognosis.
Predicting disease severity and providing appropriate treatments to patients with CAP who visit emergency medical centers is crucial; the PSI and CURB-65 are widely used for this purpose [7]. Although the PSI showed higher accuracy in predicting 30-day mortality than CURB-65, the PSI procedure is complicated and time-consuming in clinical settings because it considers many variables [7,36,37]. In contrast, CURB-65 is simpler to use than the PSI, but its predictive power decreases as the patient’s age increases [11,38]. Similar to previous studies, the patients enrolled in this study were 65 years or older, and the predictive power of CURB-65 for 28-day mortality was lower than that of the muscle index. It is reasonable to use the PSI or muscle index to evaluate the prognosis of elderly patients with CAP, but the muscle index, which can be measured rapidly, is more useful in an emergency medical center where time is limited.
This study has several limitations. First, this was a retrospective study conducted at a single regional emergency medical center, which might have caused selection and recall bias. The relatively small study population also limits the generalizability of the results, which should be verified in multicenter, large-scale, prospective studies. Second, errors might have occurred because the muscle area and attenuation were measured manually. To minimize such errors, two physicians unaware of each patient's baseline characteristics independently conducted the measurements twice. The reliability of the muscle measurements between the two reviewers, as measured by ICC, was excellent. Third, this study included patients who underwent chest CT within 48 hours before or after hospital admission. The variation in the timing of the CT scan could thus be up to 96 hours, which might have influenced the results. However, 74.6% of patients underwent chest CT within 12 hours before admission. Only nine patients had the CT scan either 24 hours before or 24 hours after admission. No statistically significant differences in CT timing were observed between the survivor and nonsurvivor groups. Fourth, only patients diagnosed with CAP using chest CT were included in this study. Patients who were too unstable to undergo chest CT at initial admission or were diagnosed with pneumonia through other clinical findings and imaging, such as an x-ray or abdominal CT, were not included in the study. Fifth, our hospital has no specific chest CT indications for pneumonia patients, which might limit the study's generalizability. Sixth, we assessed only the need for ICU admission; detailed assessments such as ICU mortality, ICU-free days, and ventilator-free days were not included in this study. Further studies addressing those associations in an ICU setting are required.
Despite those limitations, this study has confirmed that sarcopenia, measured on CT as the paraspinal muscle index, is a prognostic factor in elderly patients with CAP. This distinctive study is the first to demonstrate the superiority of the paraspinal muscle index in predicting 28-day mortality over the already validated PSI. Because chest CT is commonly used to diagnose pneumonia, assessing sarcopenia using chest CT can be a simple and effective method that does not require additional costs or tests, making it suitable for clinical practice, including in emergency medical centers.
In conclusion, a high paraspinal muscle index in elderly patients with CAP is associated with low 28-day mortality, and the predictive power of the muscle index is higher than that of PSI or CURB-65. The paraspinal muscle index is expected to be useful for predicting prognosis because it can be measured easily and quickly without a cost burden in emergency medical centers.